RE/MAX Crest Realty
Toronto Market Report Infographics
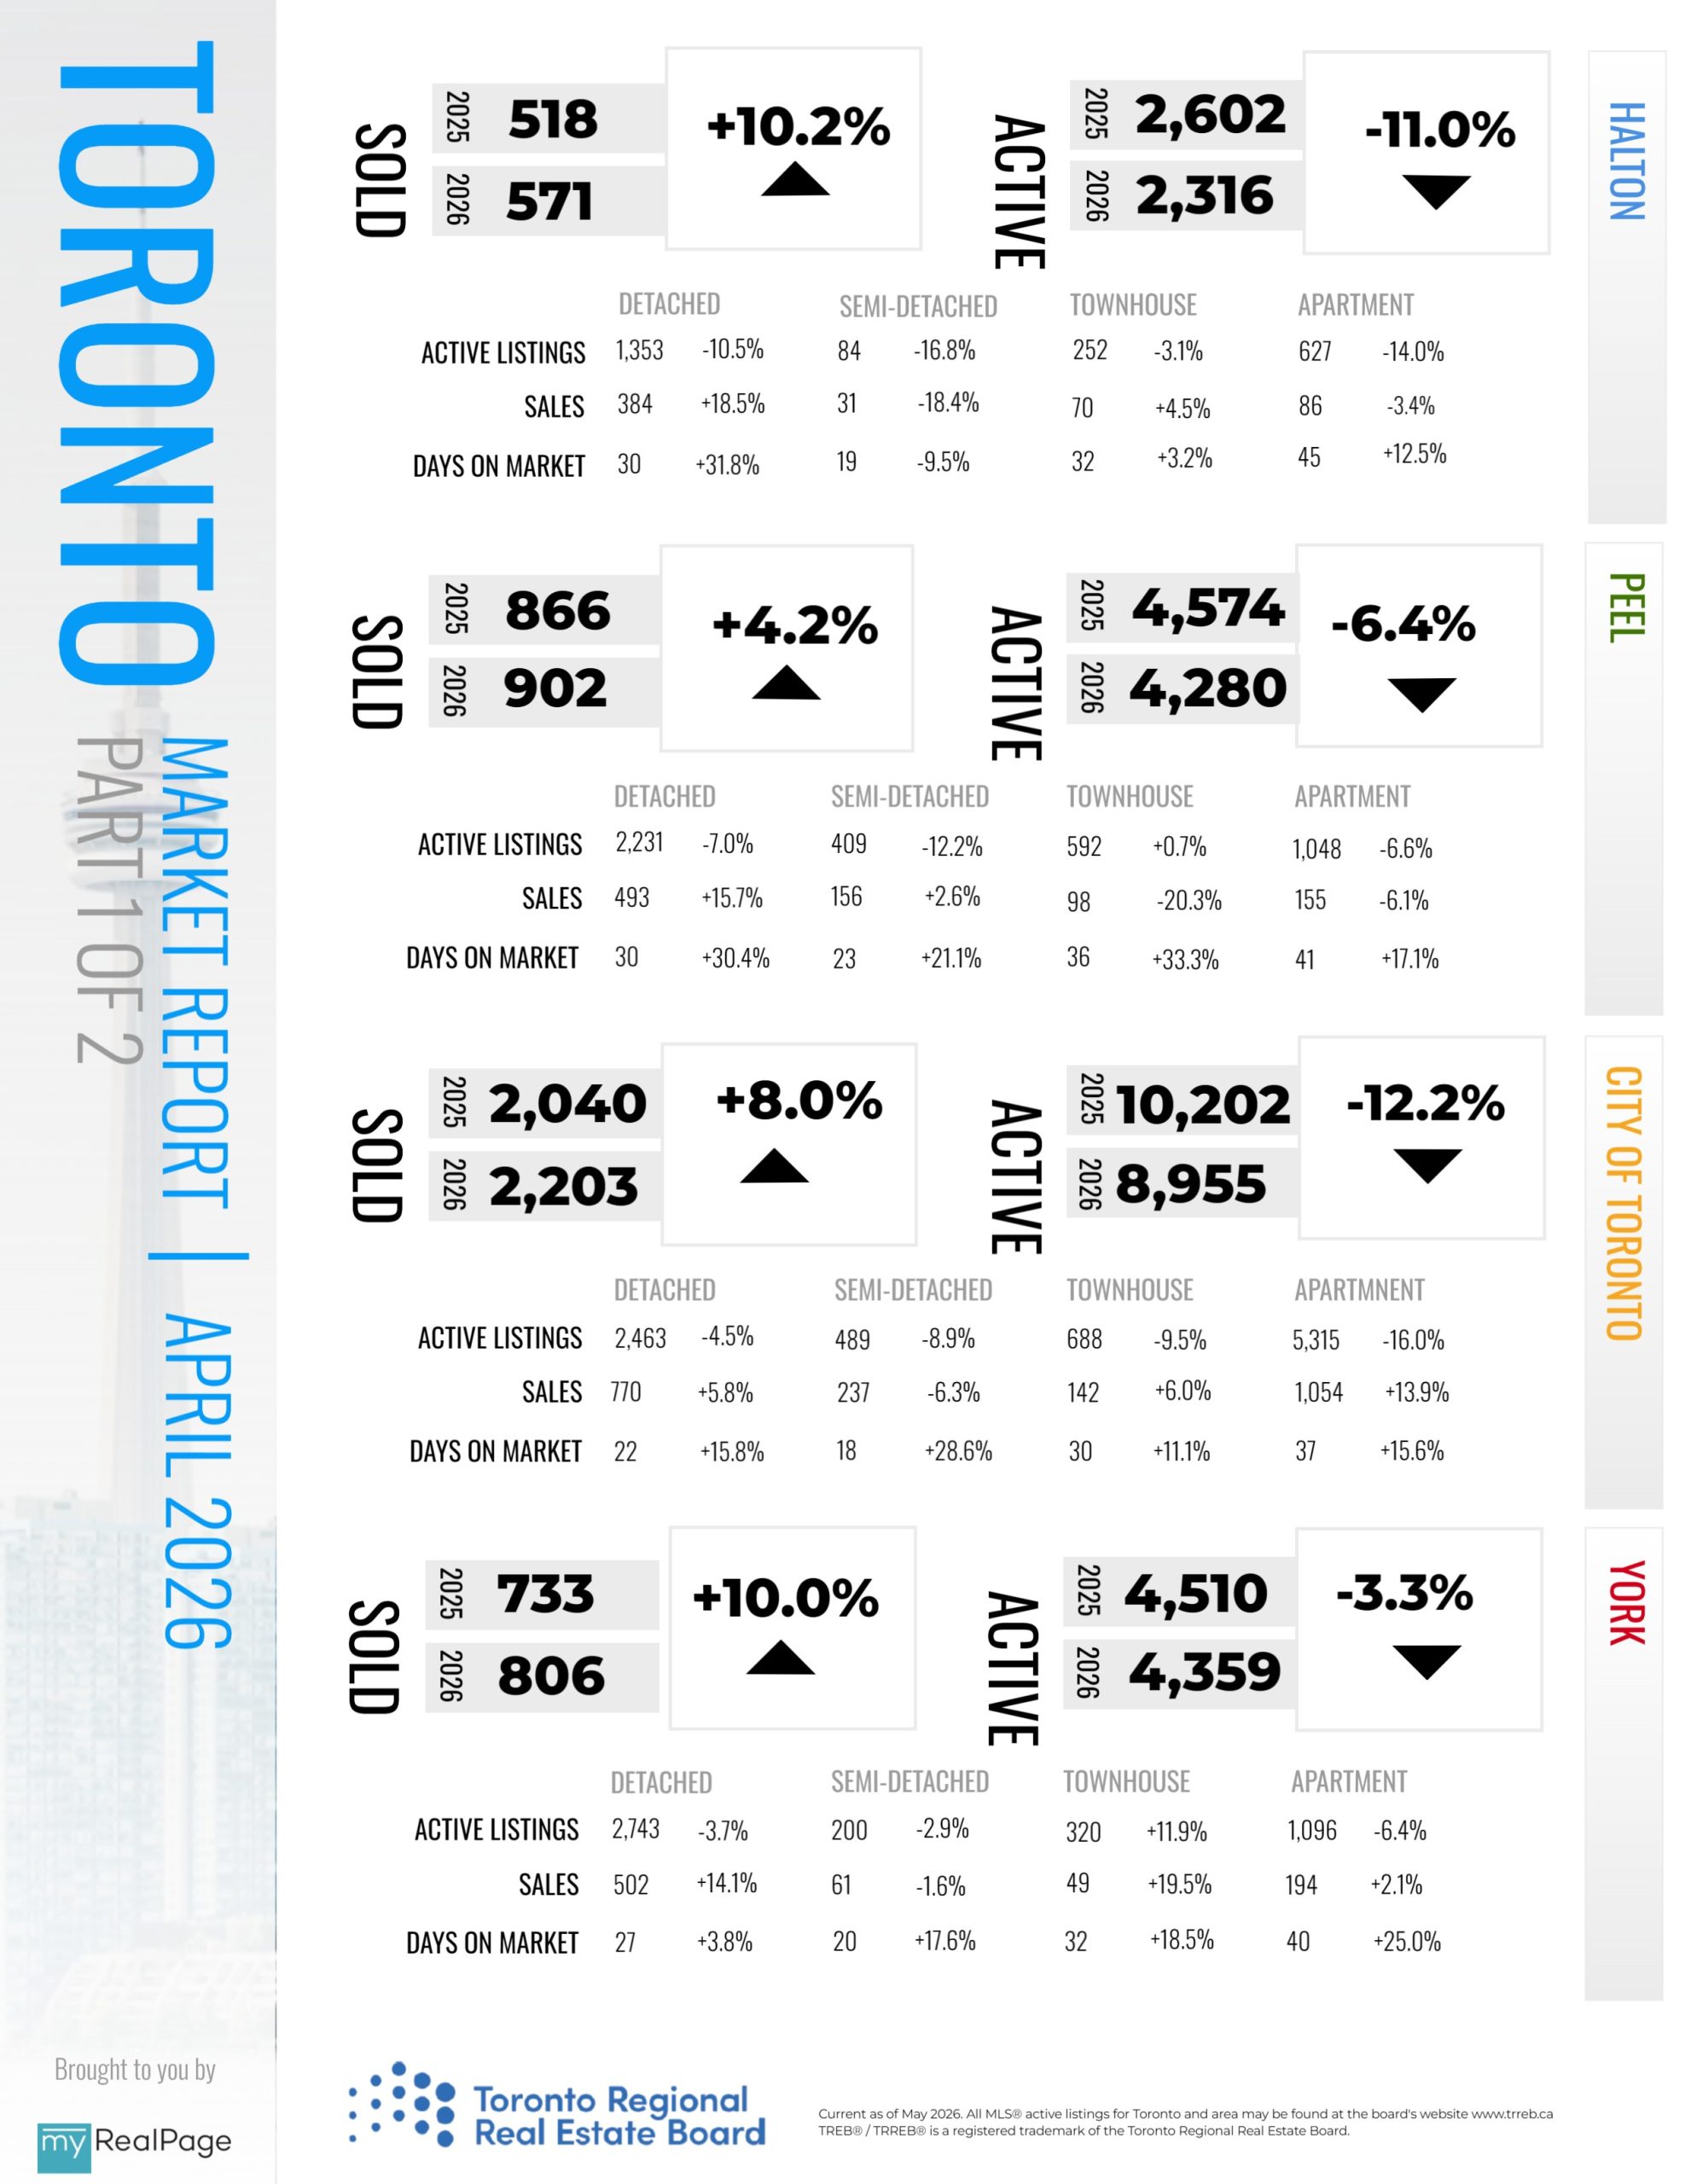
INFOGRAPHICS: April 2026 TRREB Toronto Market Reports

GTA REALTORS Release April Stats
Home sales increased on a year-over-year basis in April 2026, while the supply of listings trended lower. This suggests that overall market conditions in the Greater Toronto Area (GTA) tightened during the first full month of spring. Despite tighter market conditions, selling prices edged lower on average compared to last year, as buyers continued to benefit from ample choice and negotiating power.
“We have experienced an uptick in home buying activity so far this spring. Buyers have taken advantage of more affordable housing market conditions on the back of lower home prices. If market conditions continue to tighten and home prices level off, this could be a signal to intending homebuyers who remain on the sidelines,” said TRREB President Daniel Steinfeld.
“Lower home prices and borrowing costs over the past year have been a catalyst for some homebuyers this spring. However, we still have a substantial amount of pent-up demand in the marketplace. More certainty on the trade front and an easing in geopolitical tensions would result in further improvements in market activity,” said TRREB’s Chief Information Officer Jason Mercer.
Read the full report on TRREB website!
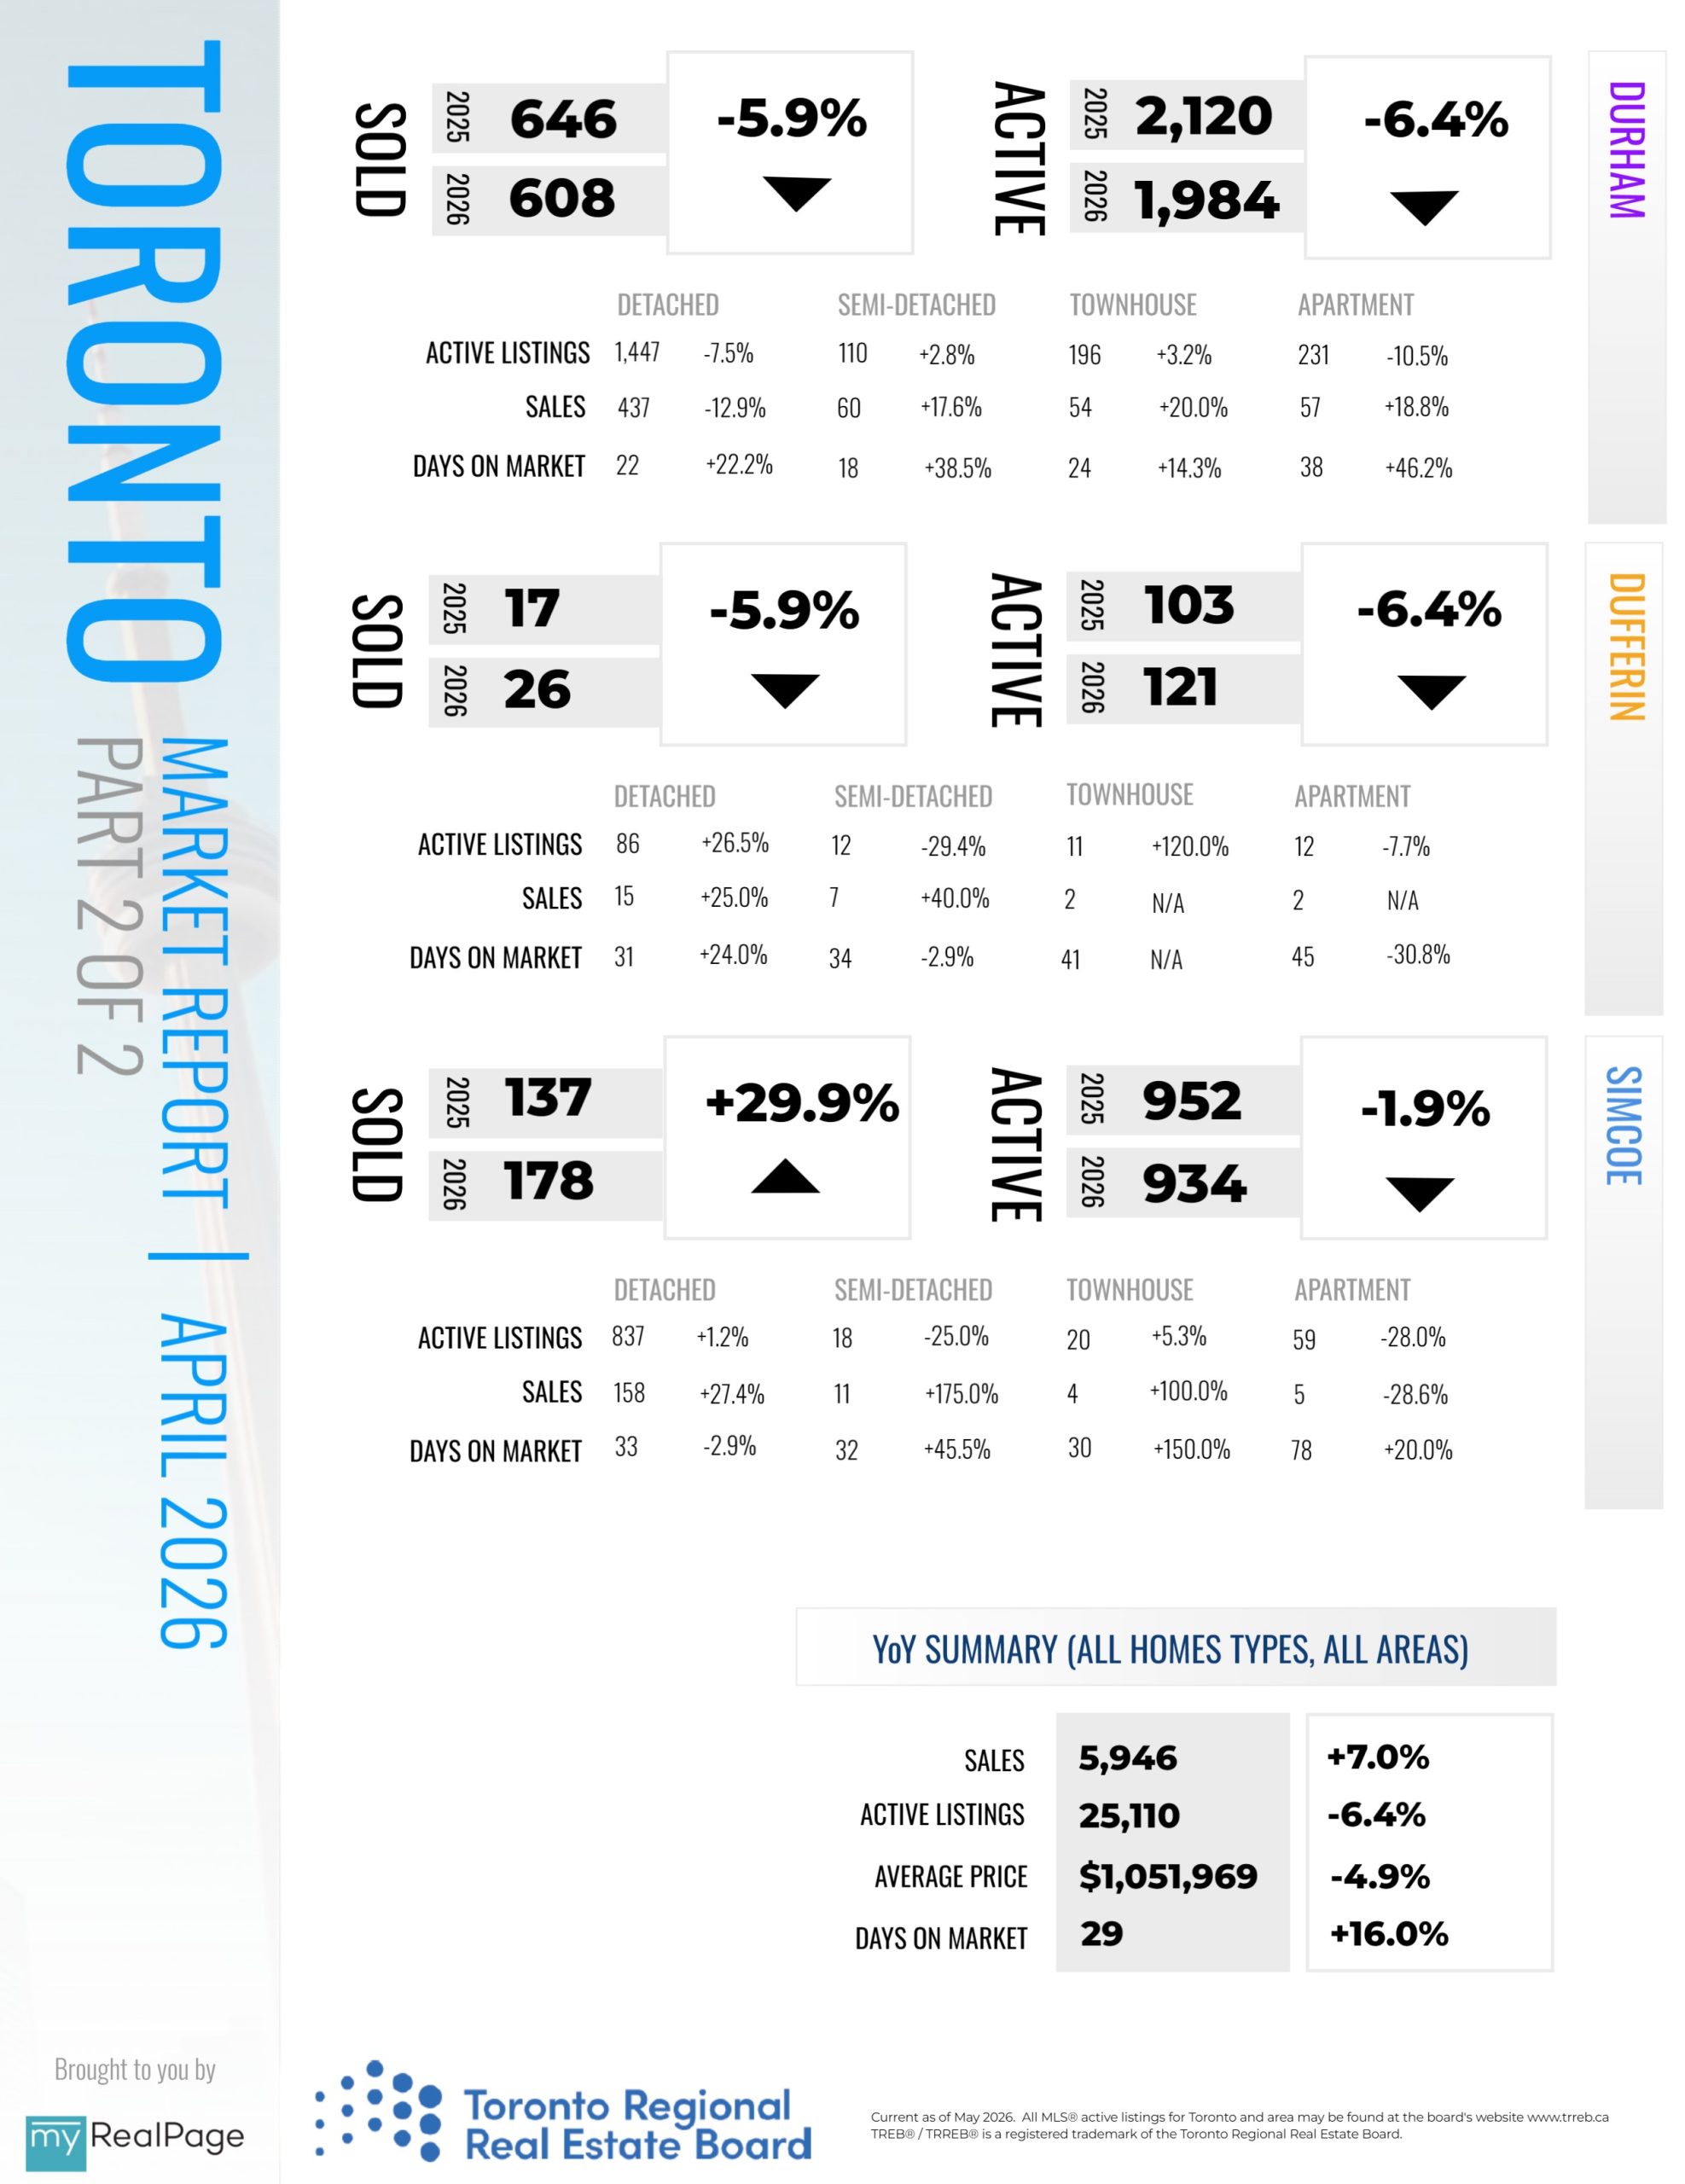
The following data is a comparison between April 2025 and April 2026 numbers, and is current as of May of 2026. For last month’s numbers, check out our previous infographic!
Or follow this link for all our TREB / TRREB Infographics!
Download Printable Version – April 2026 TRREB, Toronto Market Report
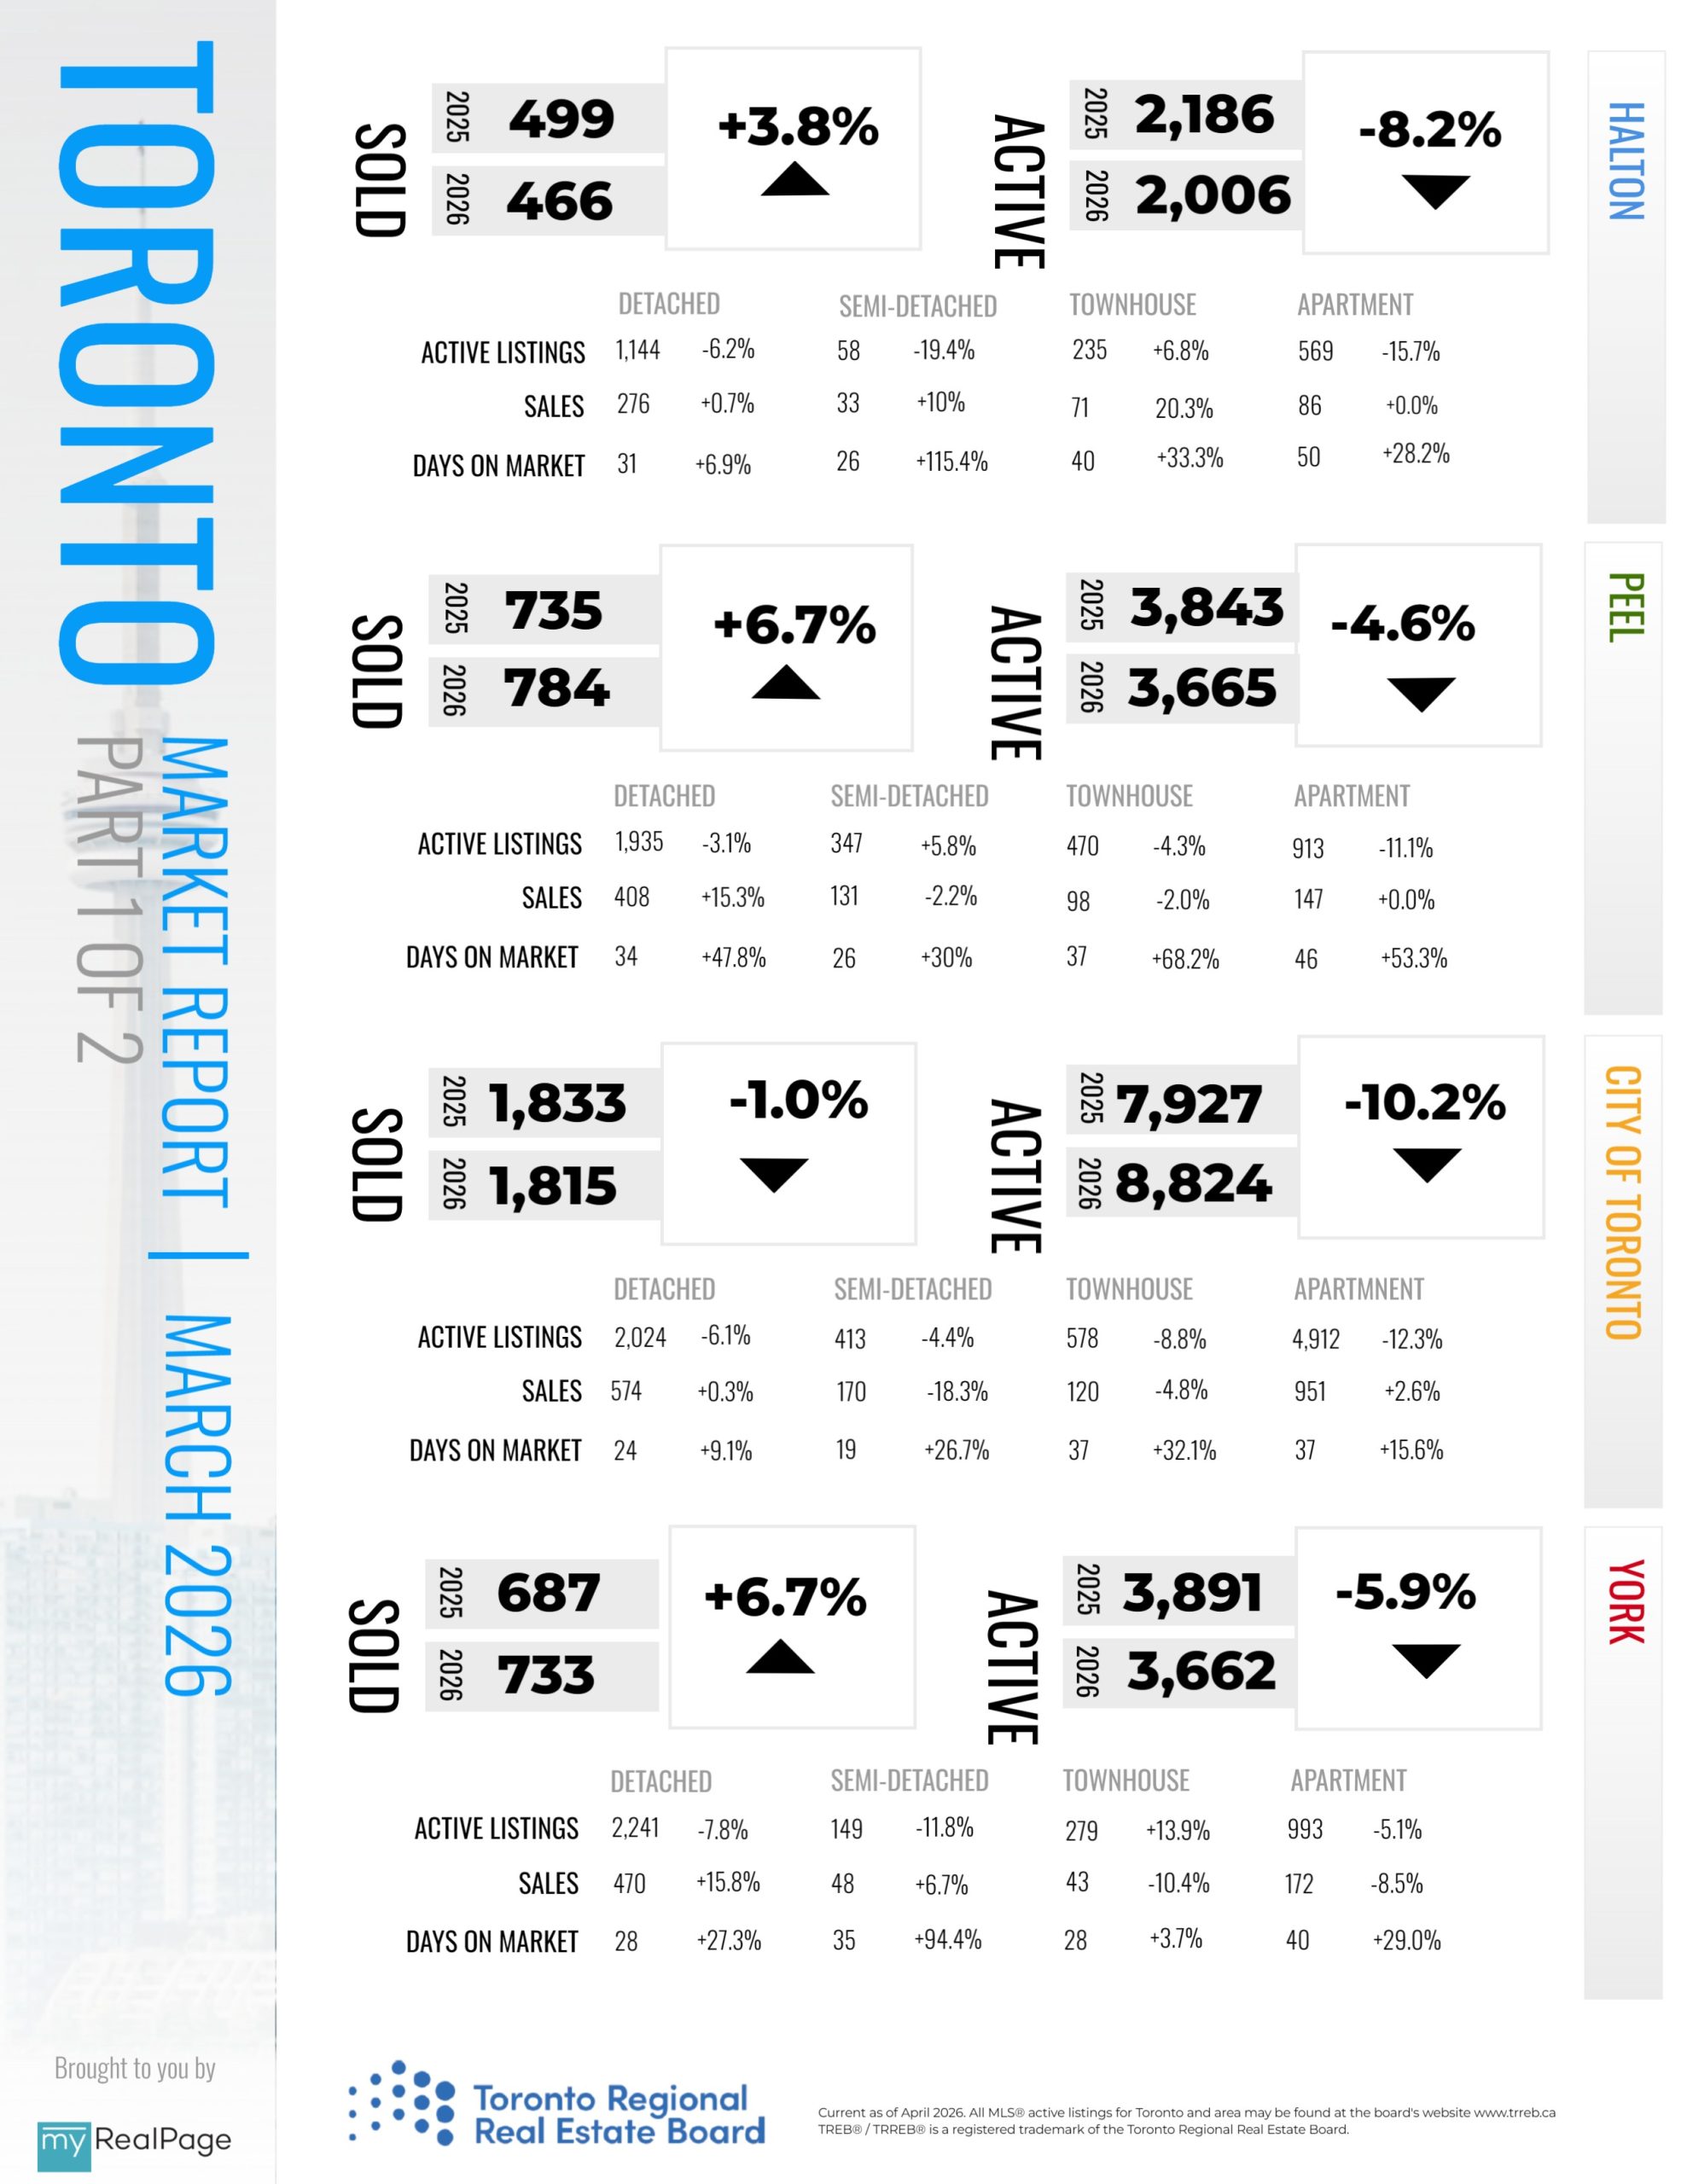
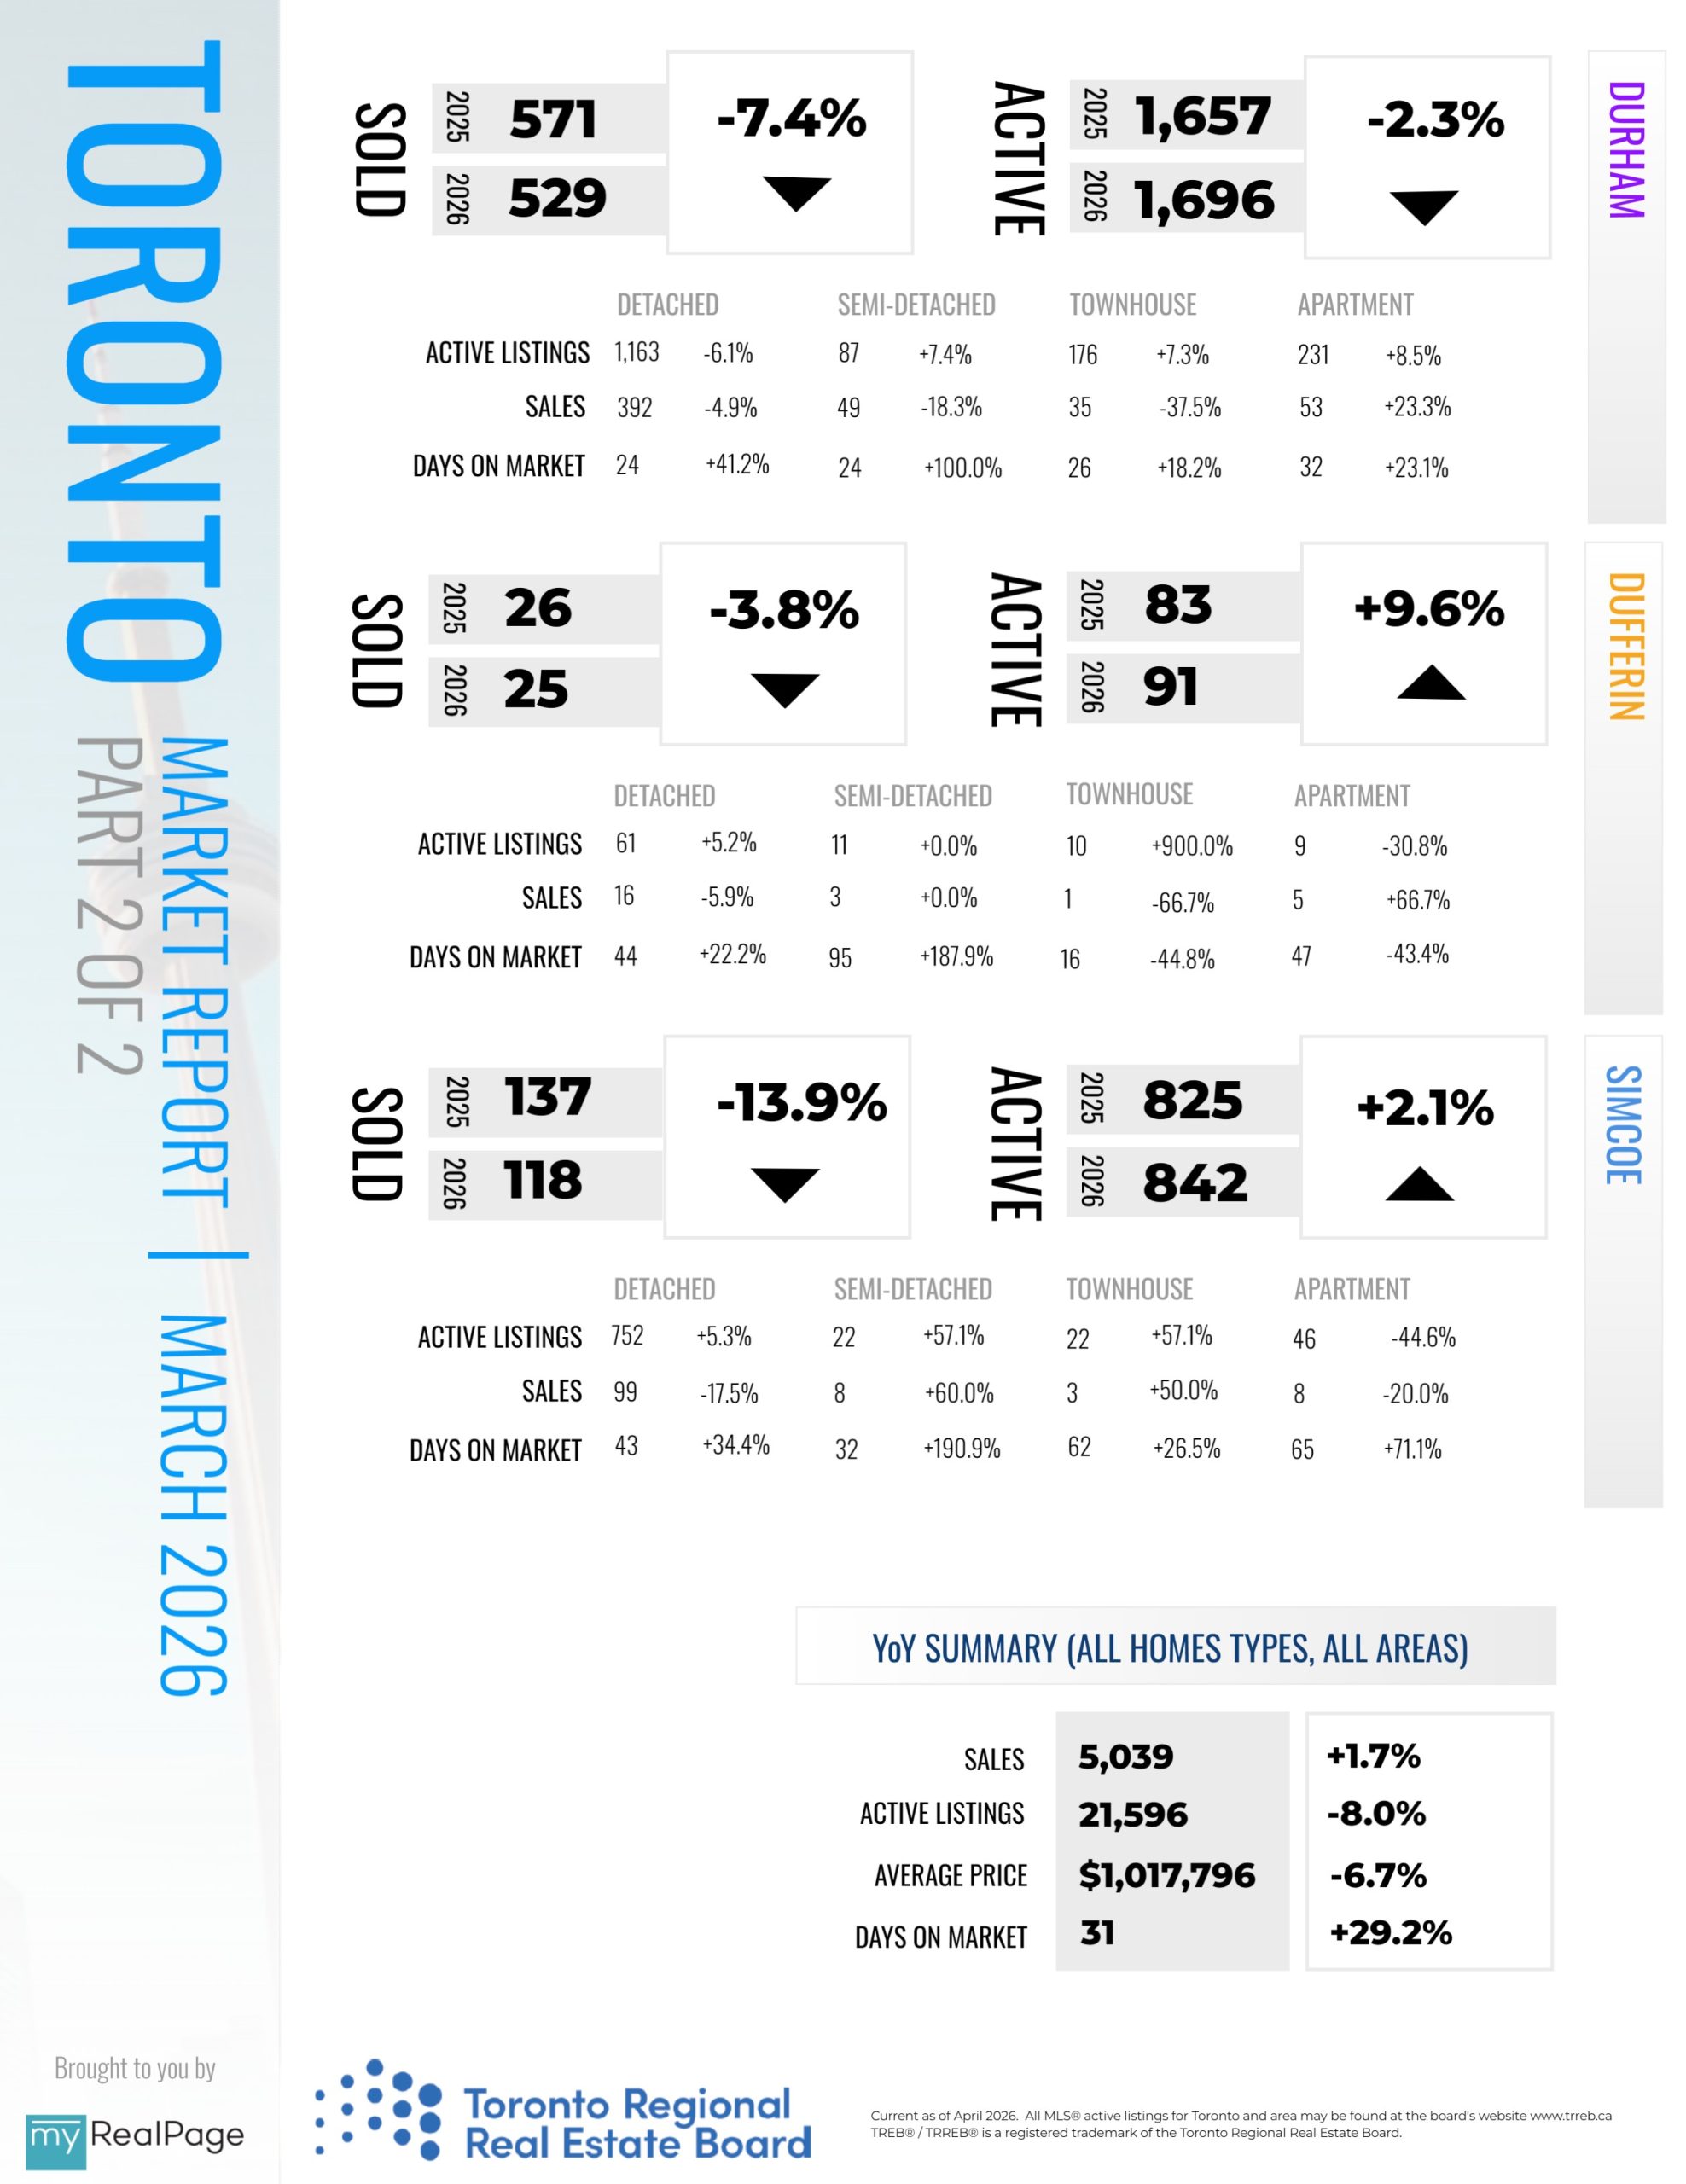
INFOGRAPHICS: March 2026 TRREB Toronto Market Reports
GTA REALTORS Release March Stats
Greater Toronto Area (GTA) resale housing market conditions tightened in March 2026 in comparison to last year. Sales were up year-over-year, while new listings were down. Selling prices were lower compared to March 2025 helping with affordability moving into the spring market.
“It’s encouraging to see an uptick in March home sales compared to last month and last year. This suggests that an increasing number of GTA households are looking to take advantage of improved affordability as we move into the spring market. Positive news on trade and geopolitical issues would help improve consumer confidence and home sales in the months ahead,” said TRREB President Daniel Steinfeld.
“Buyers continued to benefit from substantial negotiating power on price across major market segments in the last month. This explains why benchmark and average selling prices were down year-over-year. However, if market conditions continue to tighten, as they did in March, selling prices could start levelling off as we move through the remainder of 2026,” said TRREB Chief Information Officer Jason Mercer.
Read the full report on TRREB website!
The following data is a comparison between March 2025 and March 2026 numbers, and is current as of April of 2026. For last month’s numbers, check out our previous infographic!
Or follow this link for all our TREB / TRREB Infographics!
Download Printable Version – March 2026 TRREB, Toronto Market Report
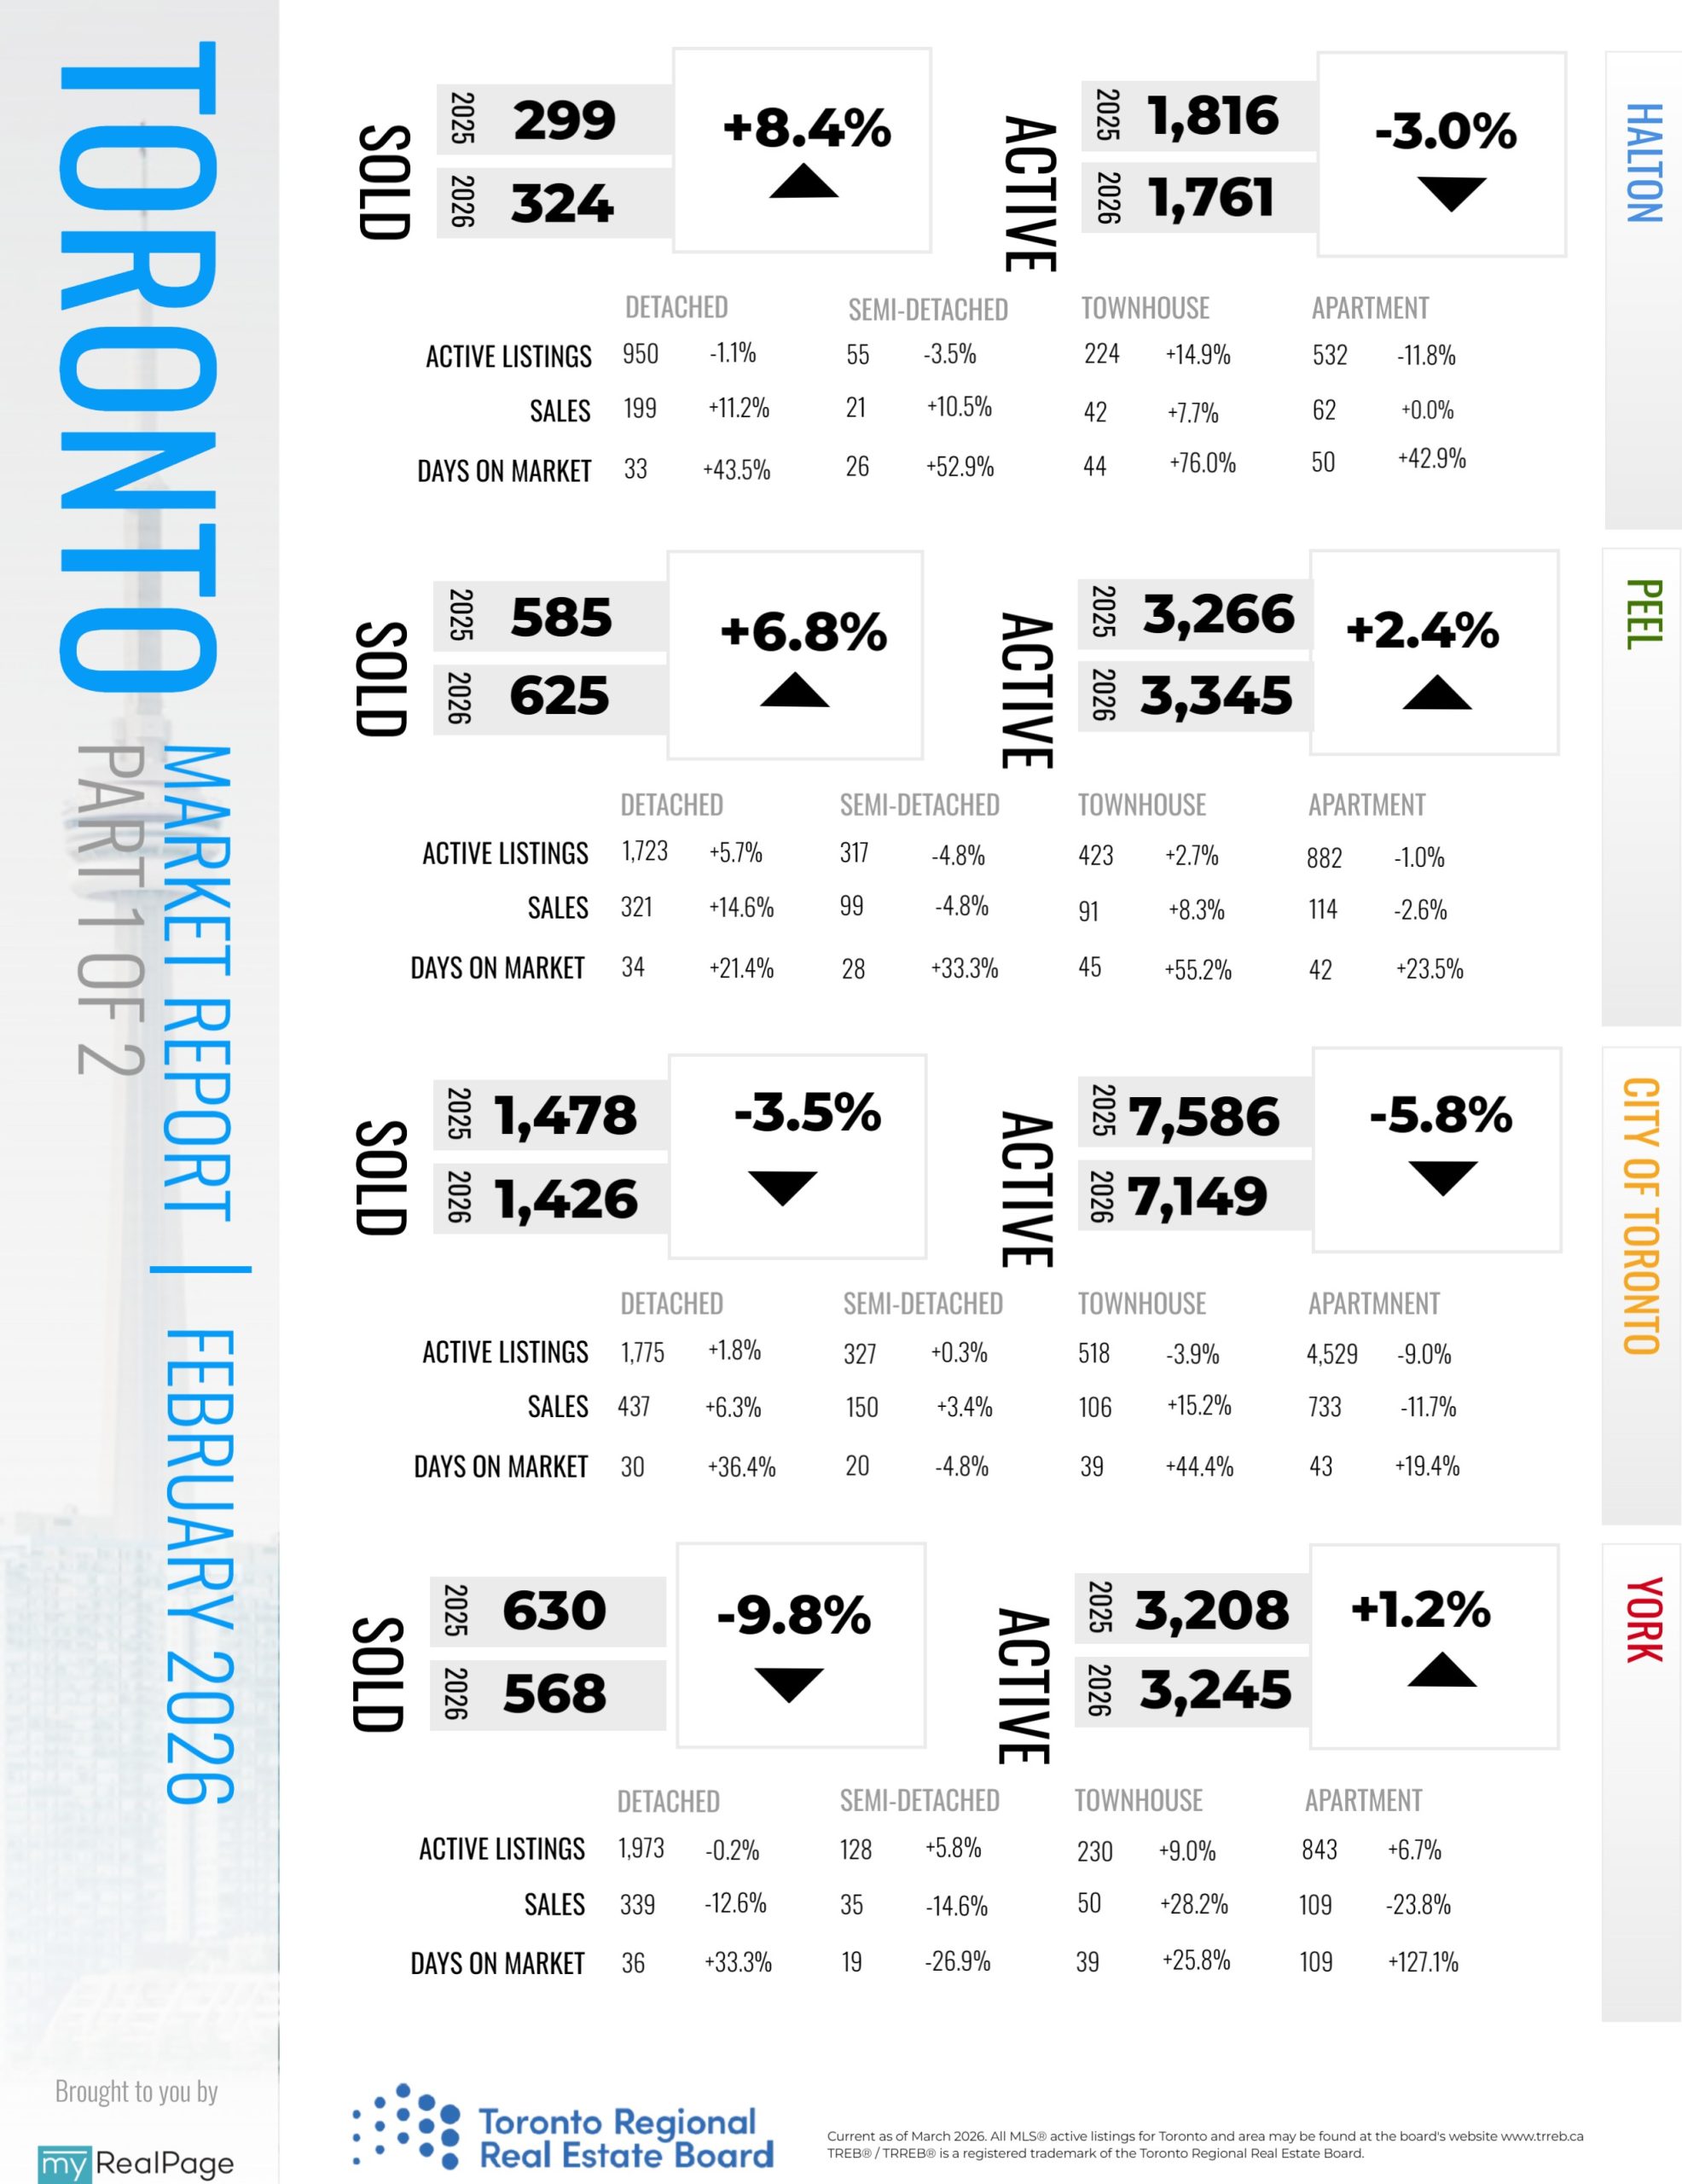
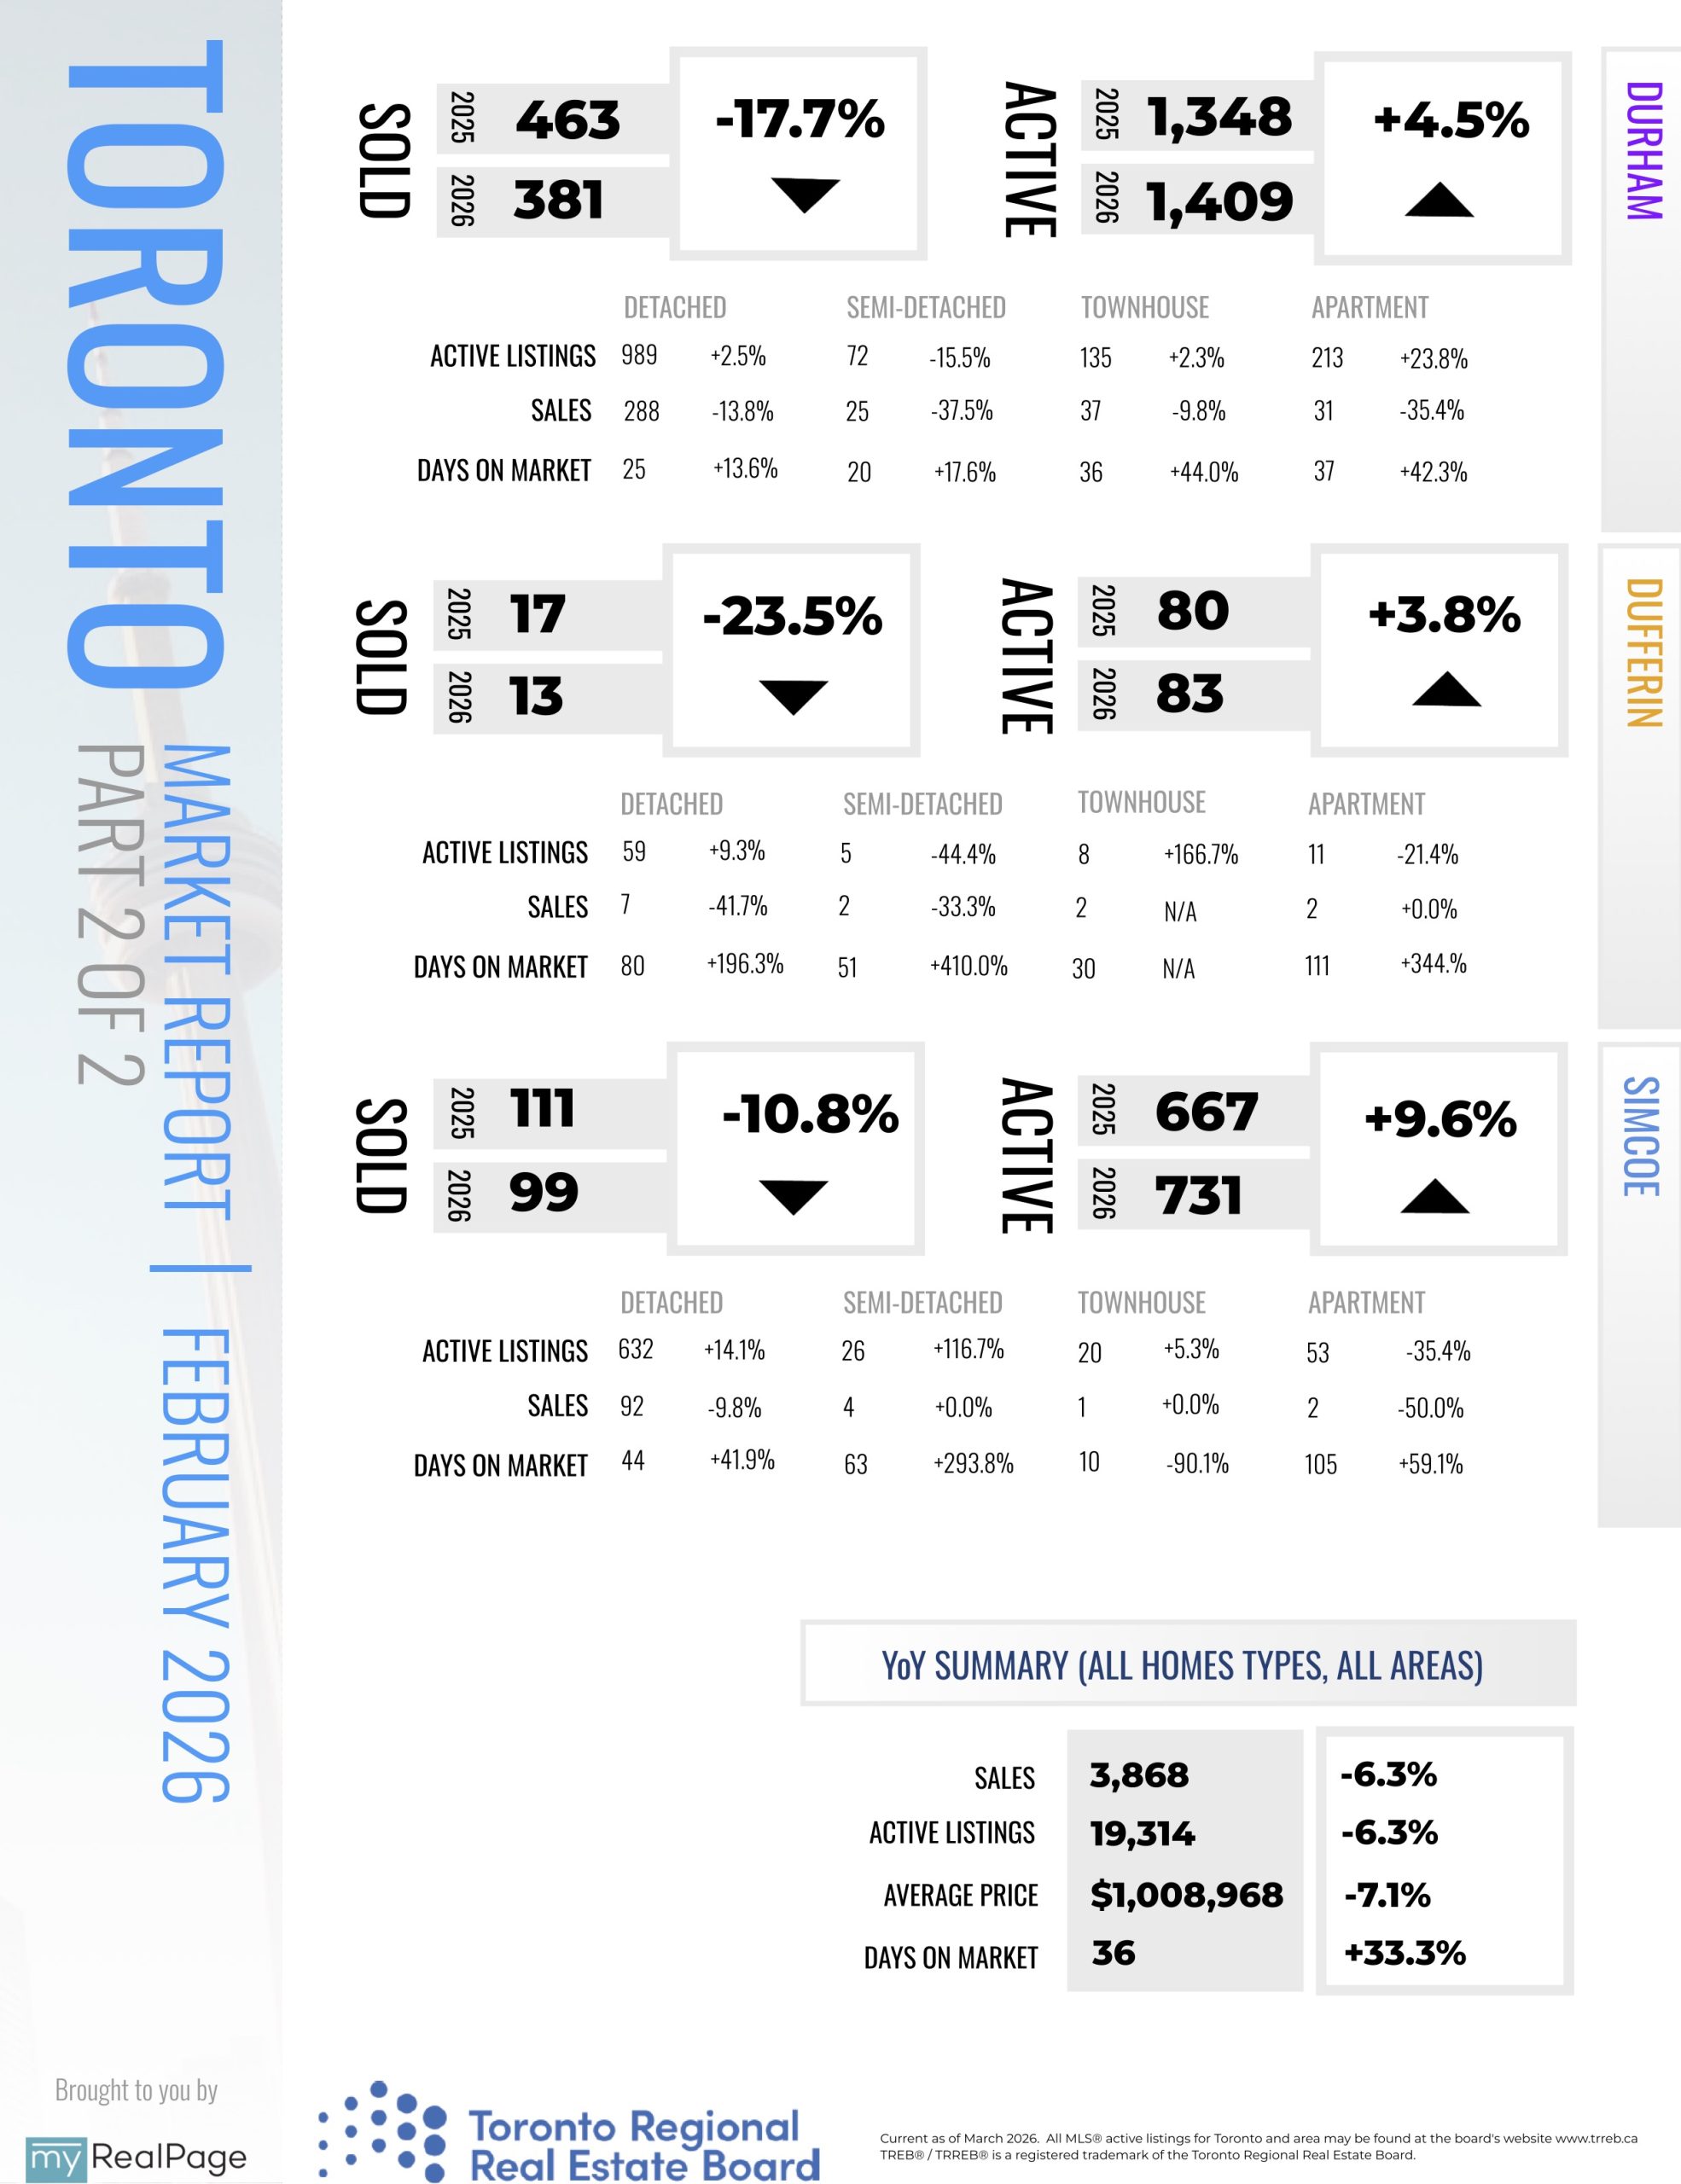
INFOGRAPHICS: February 2026 TRREB Toronto Market Reports
GTA REALTORS Release February Stats
Greater Toronto Area (GTA) resale housing market conditions tightened in February 2026 compared to February 2025. While sales were down year-over-year, new listings declined by a greater annual rate. The dip in new listings is in line with recent polling results from Ipsos which show listing intentions are down for 2026.
“Many would-be homebuyers are waiting for selling prices to level off before moving into the market. If new listings continue to trend lower through the spring, competition between homebuyers will increase, supporting home prices and a recovery in sales,” said TRREB President Daniel Steinfeld.
“There is substantial pent-up demand in the GTA ownership market, with more than 100,000 buyers holding off on making a home purchase. Buyers are waiting for selling prices to level off and for positive news on the trade front. Once we see both, there could be substantial momentum driving home sales in the second half of this year and into 2027,” said TRREB Chief Information Officer Jason Mercer.
Read the full report on TRREB website!
The following data is a comparison between February 2025 and February 2026 numbers, and is current as of March of 2026. For last month’s numbers, check out our previous infographic!
Or follow this link for all our TREB / TRREB Infographics!
Download Printable Version – February 2026 TRREB, Toronto Market Report
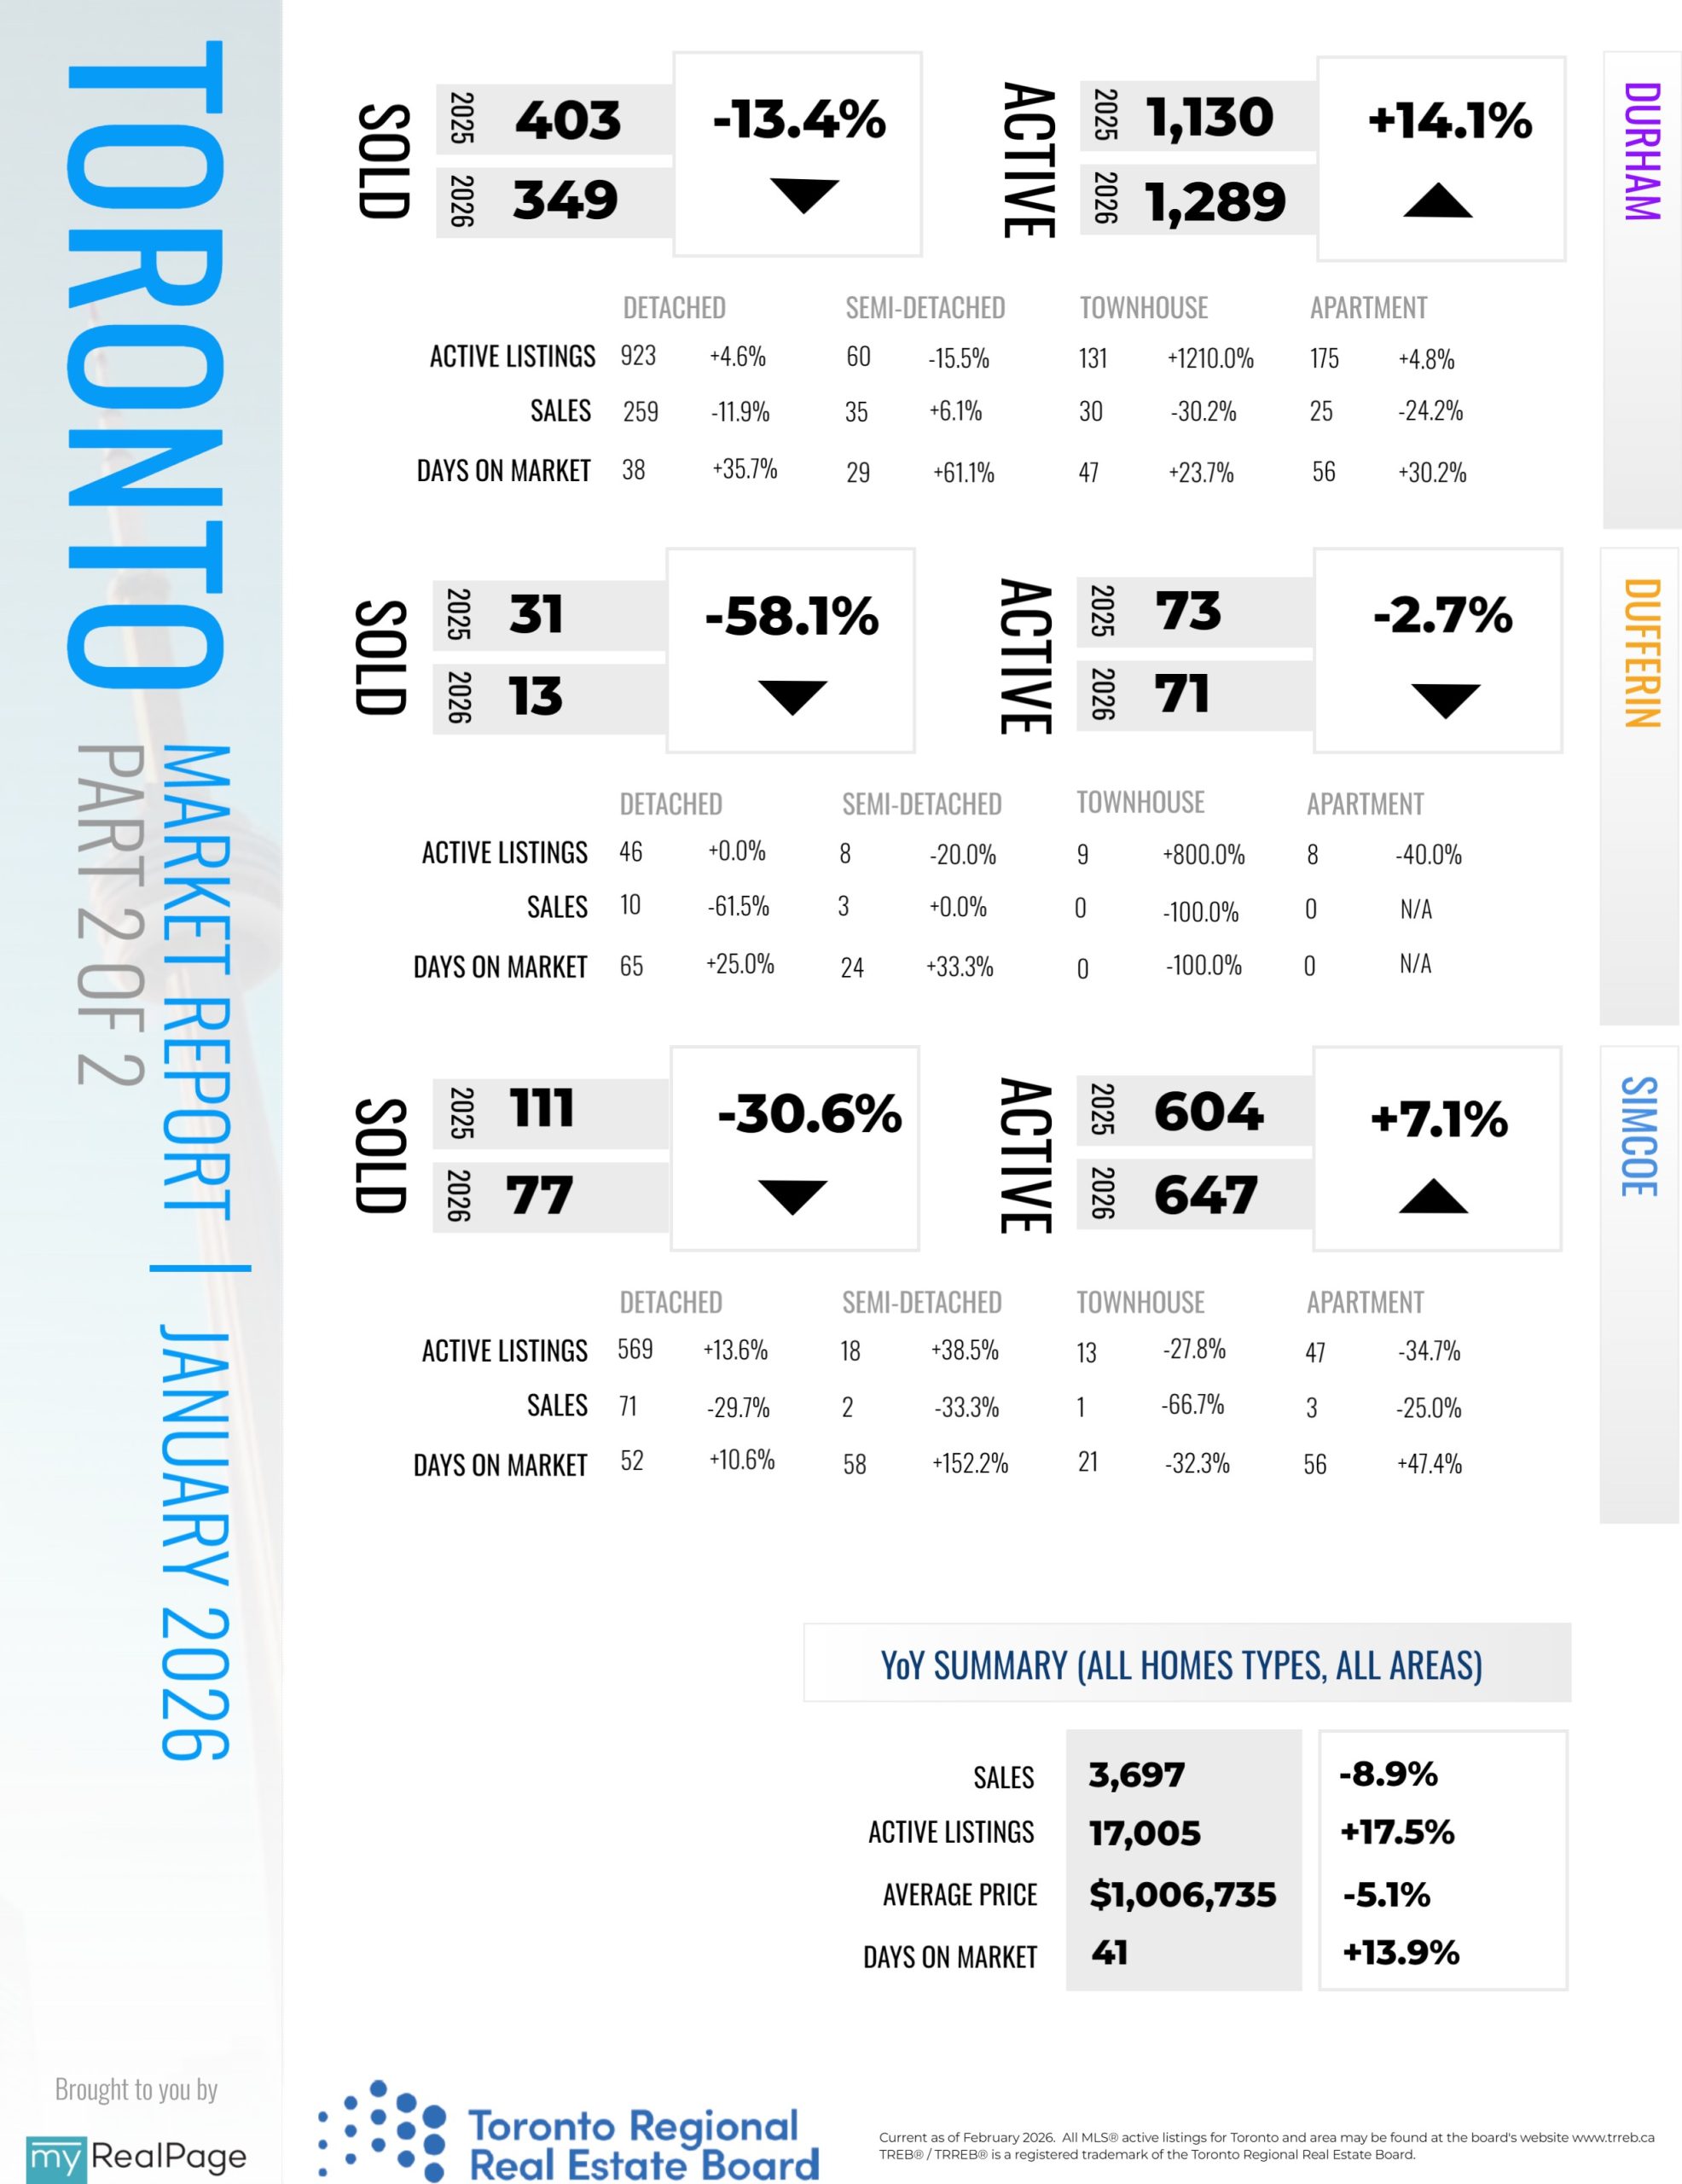
INFOGRAPHICS: January 2026 TRREB Toronto Market Reports
GTA REALTORS Release January Stats
There were 3,082 home sales reported in January 2026 – down by 19.3 per cent compared to January 2025. New listings entered into the MLS® System amounted to 10,774 – down by 13.3 per cent yearover-year. The MLS® Home Price Index (MLS® HPI) Composite benchmark was down by eight per cent yearover-year in January 2026. The average selling price, at $973,289, was down by 6.5 per cent compared to January 2025.
On a seasonally adjusted basis, January 2026 home sales were down month-over-month compared to December 2025, while new listings were up slightly. Both the MLS® HPI composite and average price trended lower compared to December.
The 2026 TRREB Market Outlook and Year in Review Report is now available. The report covers all aspects of the GTA real estate market, including trends for new homes and condominiums, as well as a review of the commercial real estate market.
Read the full report on TRREB website!
The following data is a comparison between January 2025 and January 2026 numbers, and is current as of February of 2026. For last month’s numbers, check out our previous infographic!
Or follow this link for all our TREB / TRREB Infographics!
Download Printable Version – January 2026 TRREB, Toronto Market Report

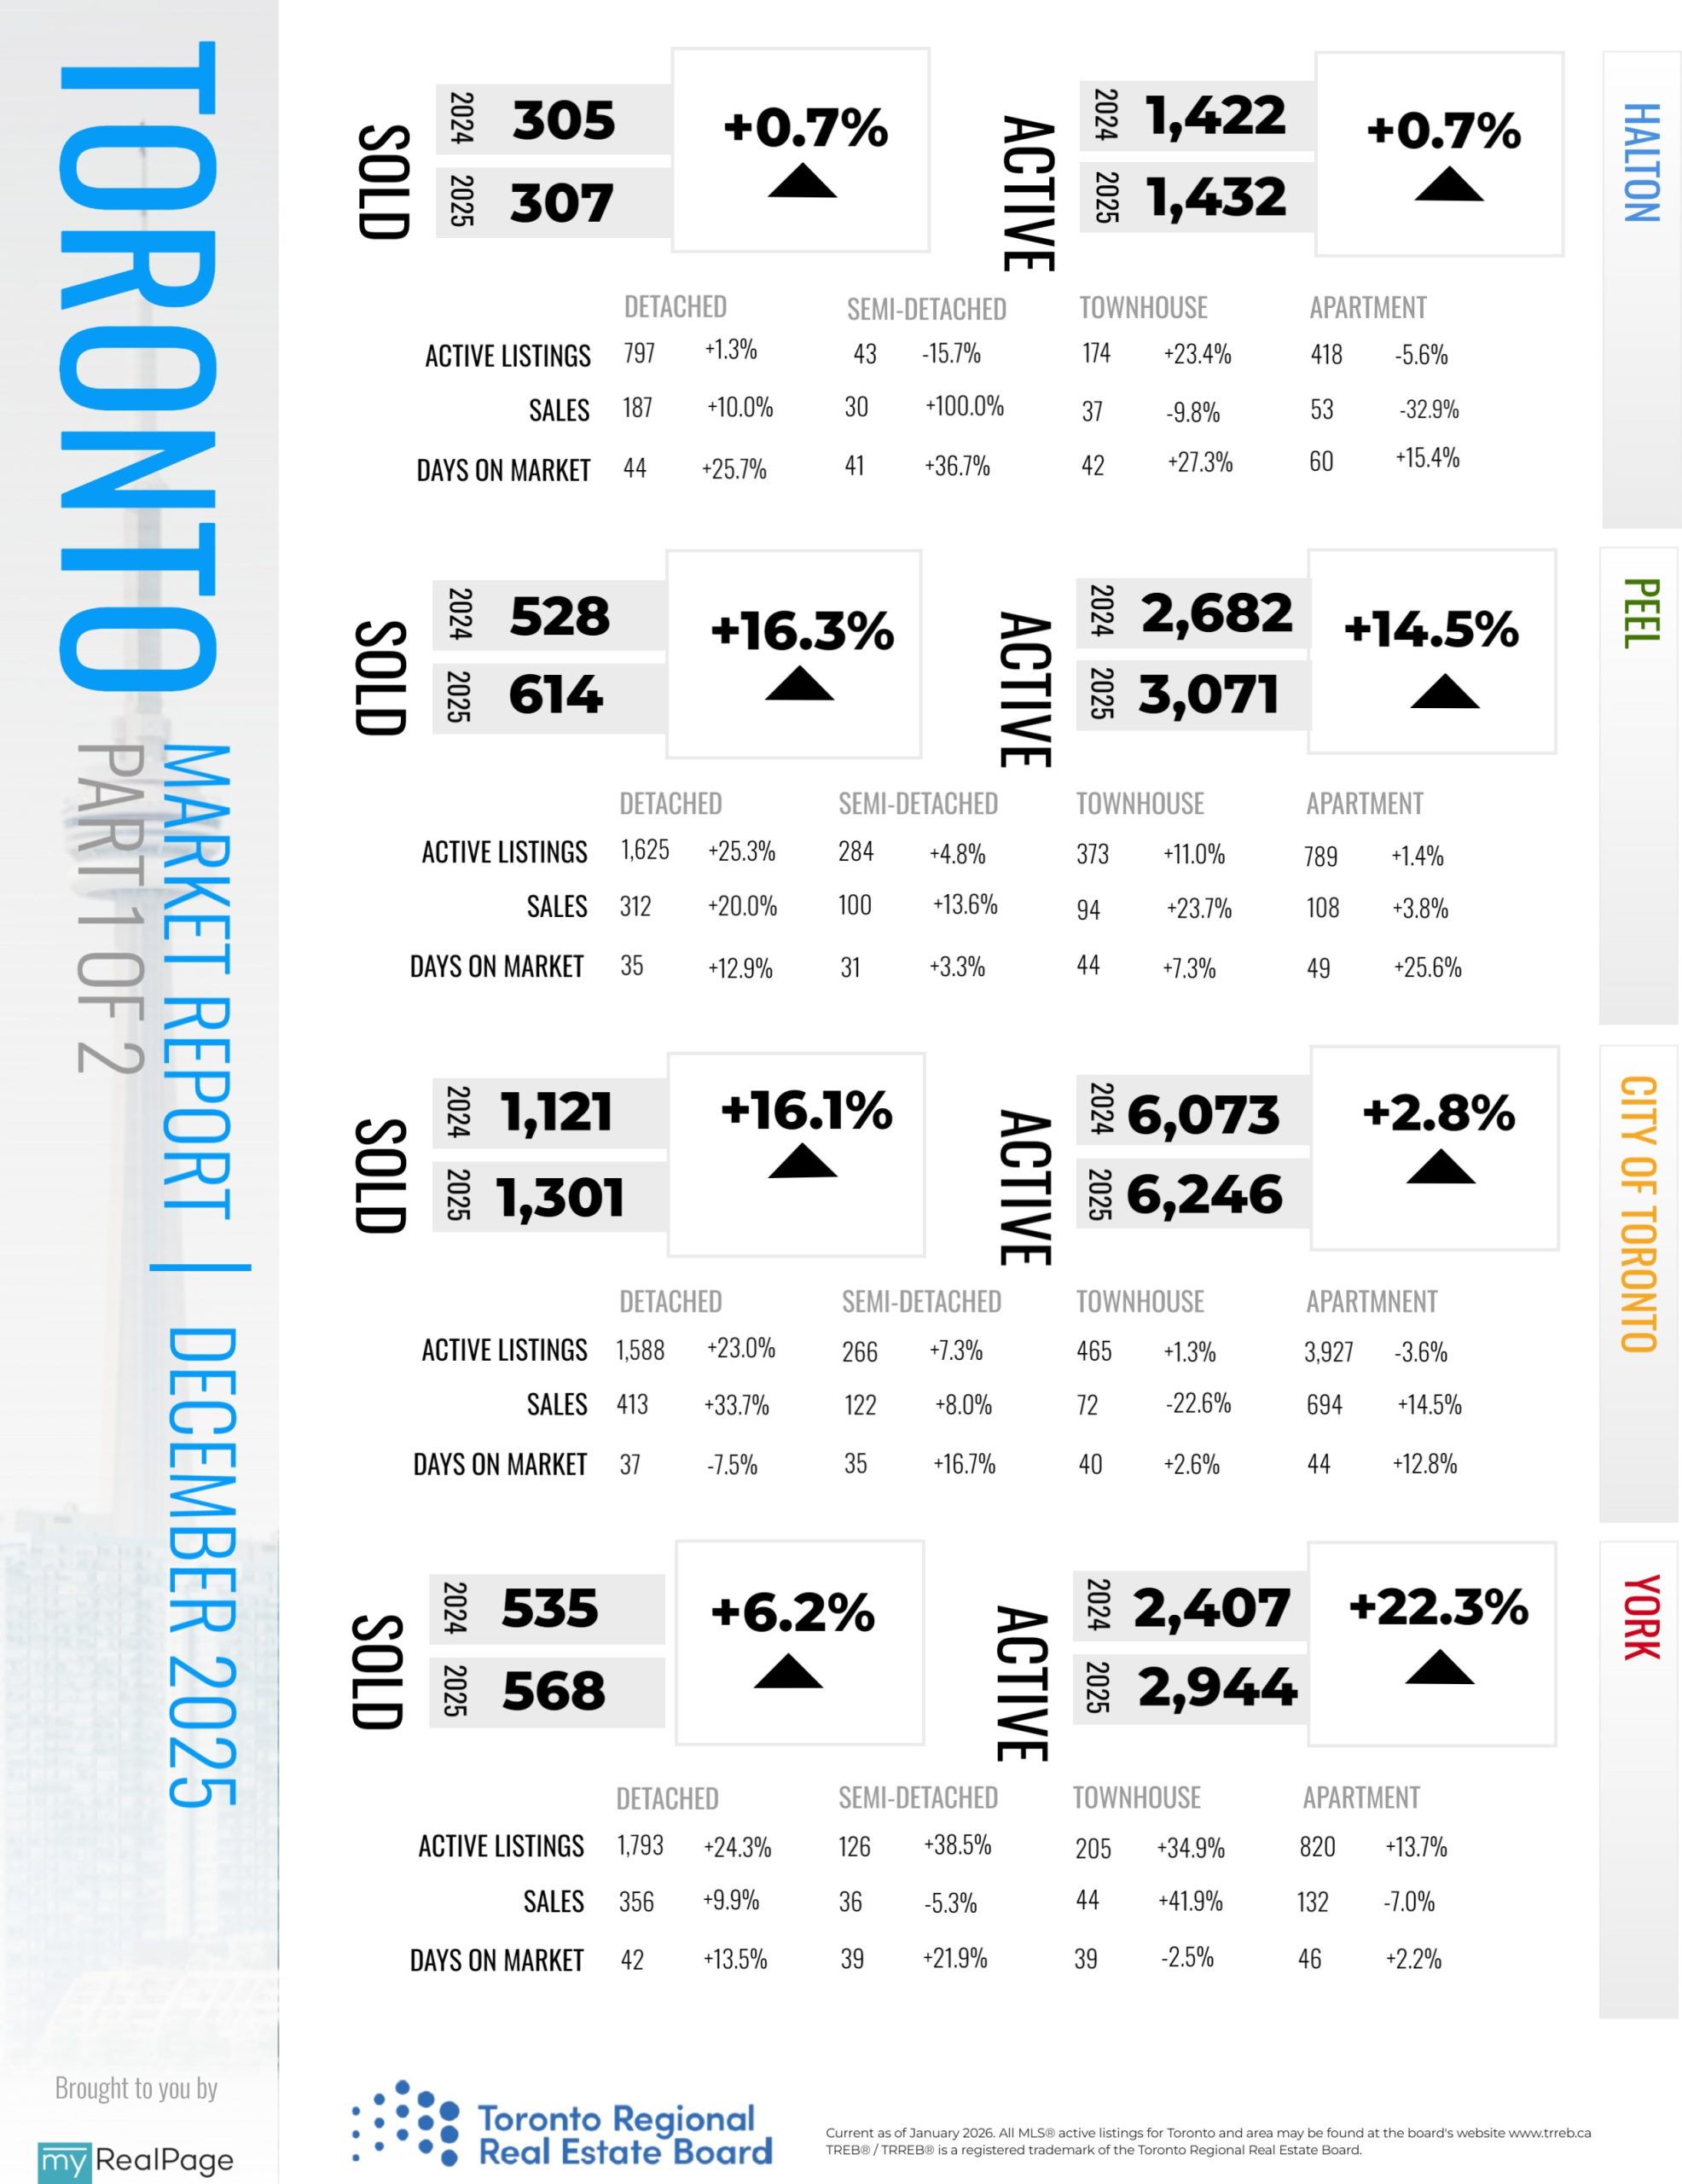
INFOGRAPHICS: December 2025 TRREB Toronto Market Reports
GTA REALTORS Release December Stats
Annual Greater Toronto Area (GTA) home sales declined in 2025 compared to 2024, as economic uncertainty weighed on consumer confidence. Over the same period, listing inventory remained elevated, allowing for selling prices to be negotiated downward, helping improve affordability.
“The GTA housing market became more affordable in 2025 as selling prices and mortgage rates trended lower. Improved affordability has set the market up for recovery. Once households are convinced that the economy and
labour market are on a solid footing, sales will increase as pent-up demand is satisfied,” said Toronto Regional Real Estate Board (TRREB) President Daniel Steinfeld.
For calendar year 2025, GTA REALTORS® reported 62,433 home sales through TRREB’s MLS® System – down by
11.2 per cent compared to 2024. New listings amounted to 186,753 – up by 10.1 per cent year-over-year. The annual average selling price in 2025 was $1,067,968 – down by 4.7 per cent compared to $1,120,241 in 2024.
Read the full report on TRREB website!
The following data is a comparison between December 2025 and December 2024 numbers, and is current as of January of 2026. For last month’s numbers, check out our previous infographic!
Or follow this link for all our TREB / TRREB Infographics!
Download Printable Version – December 2025 TRREB, Toronto Market Report

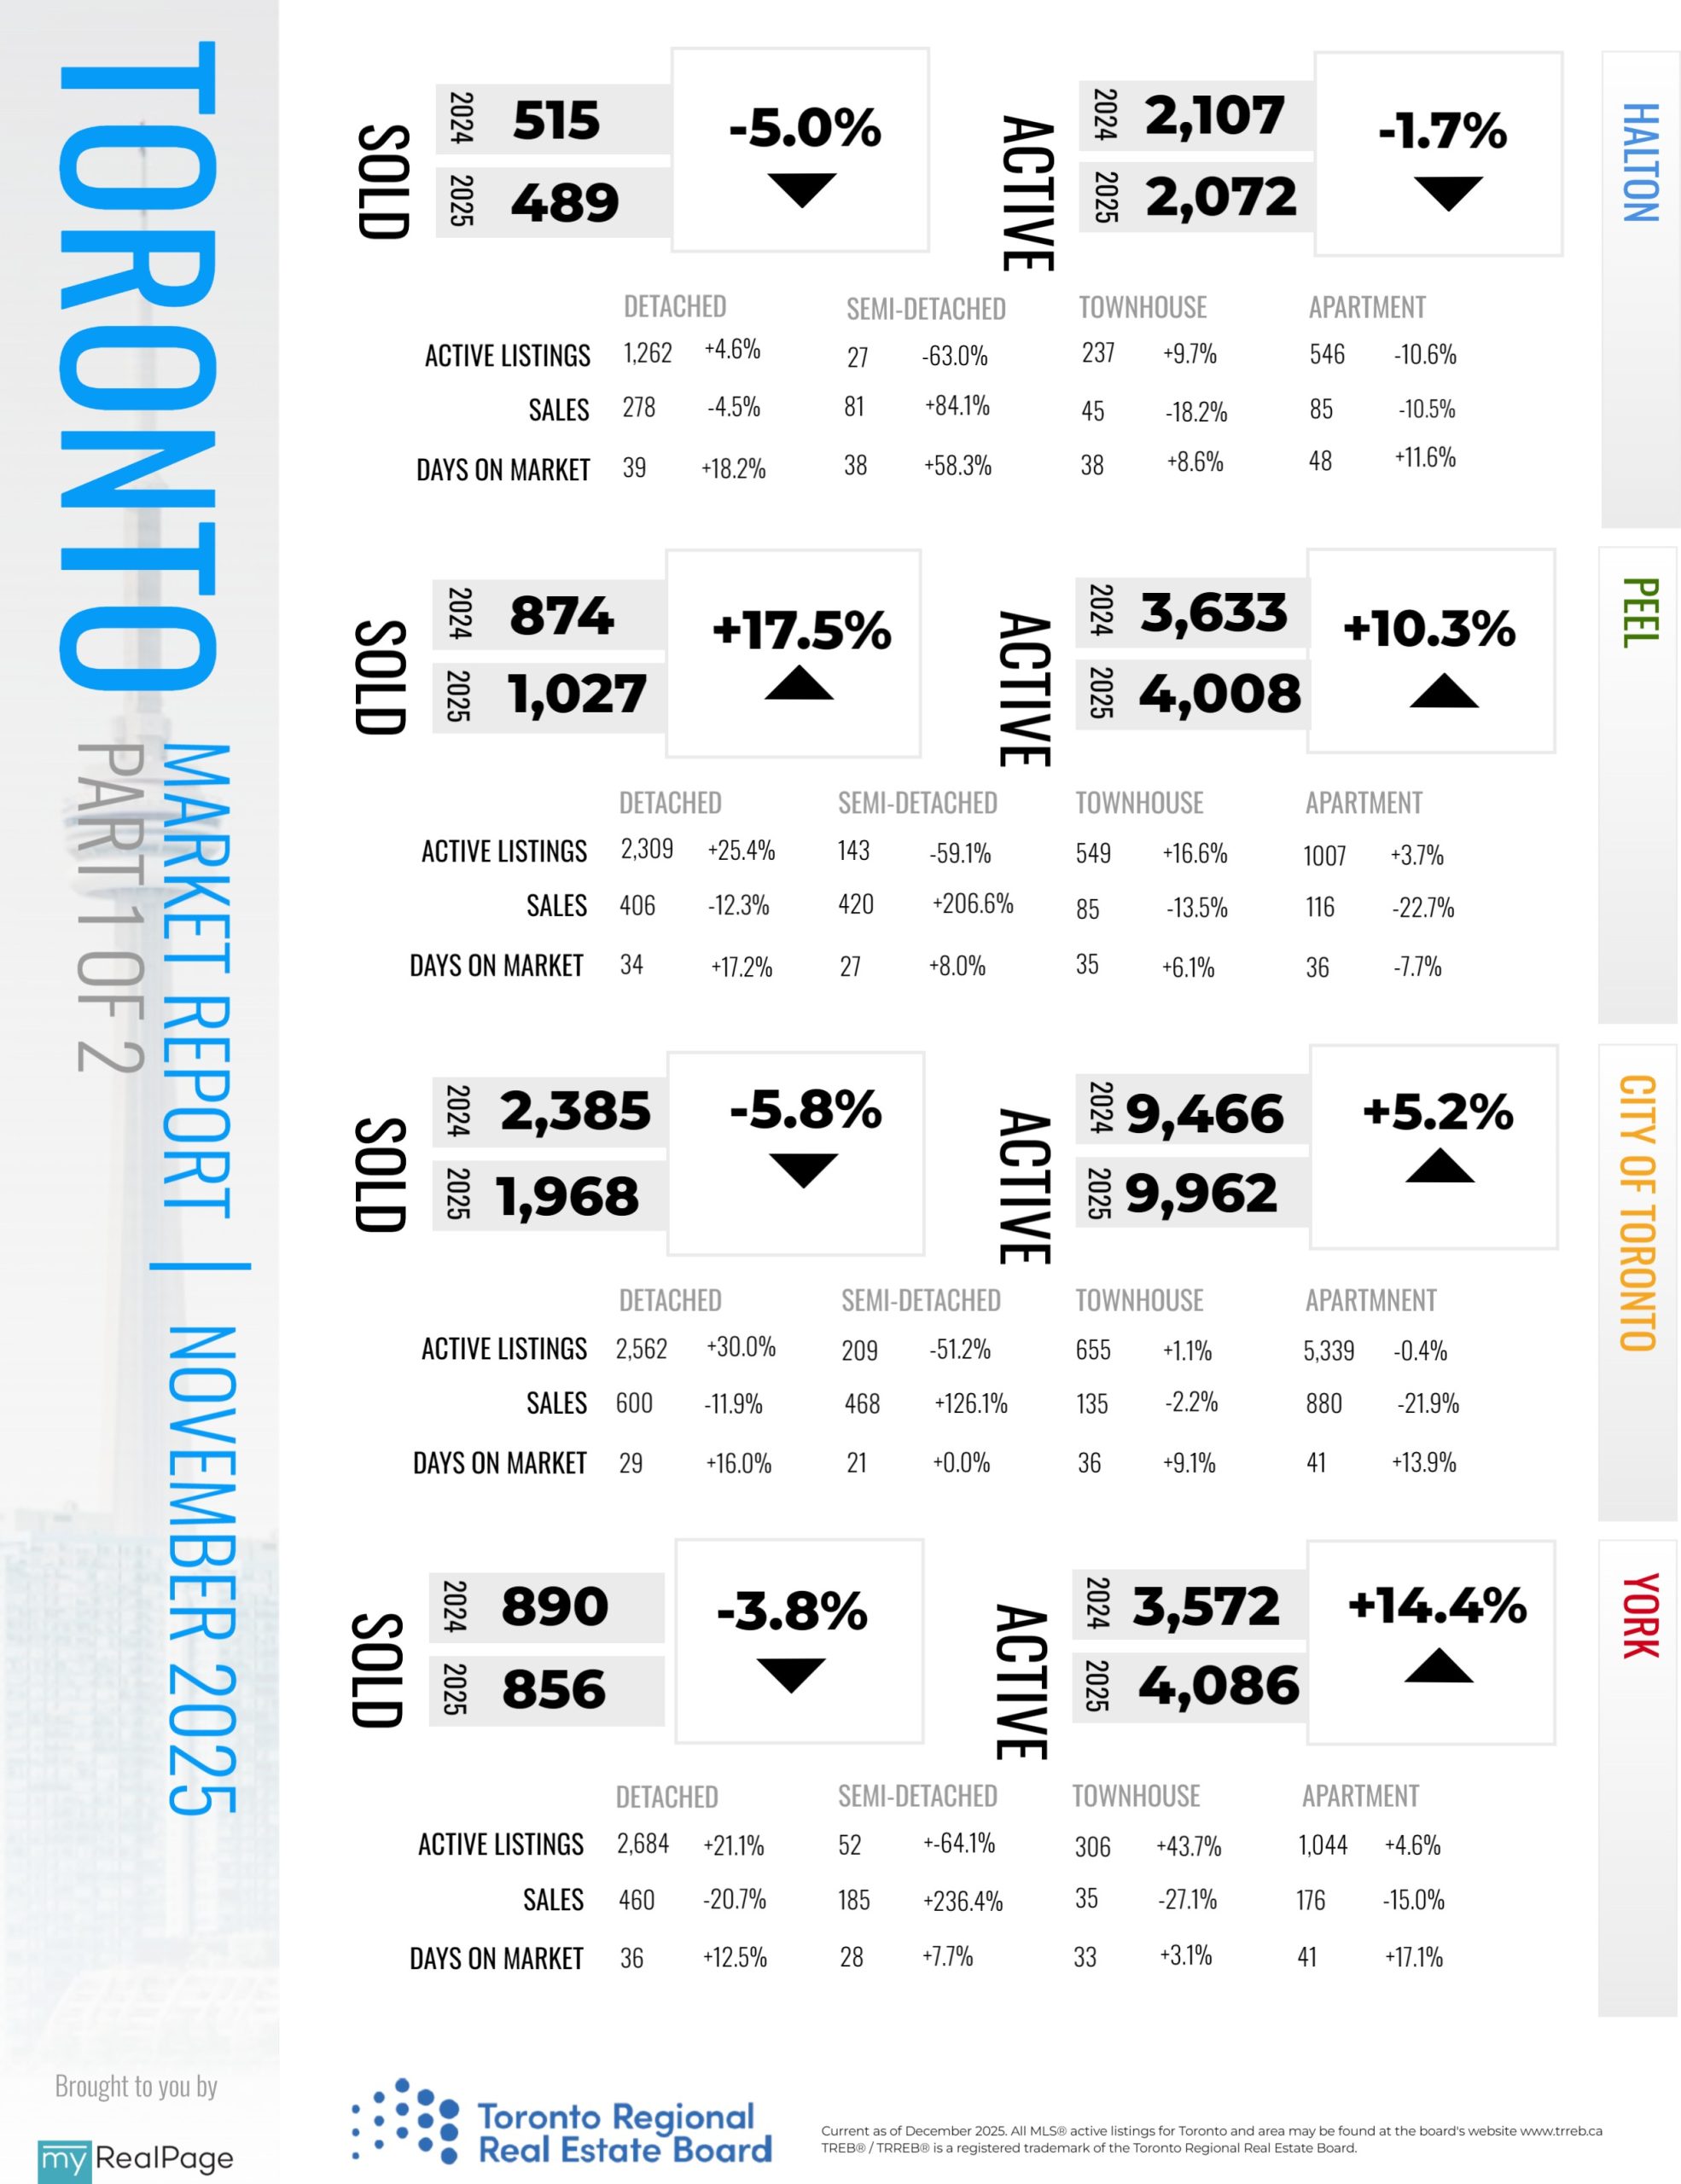
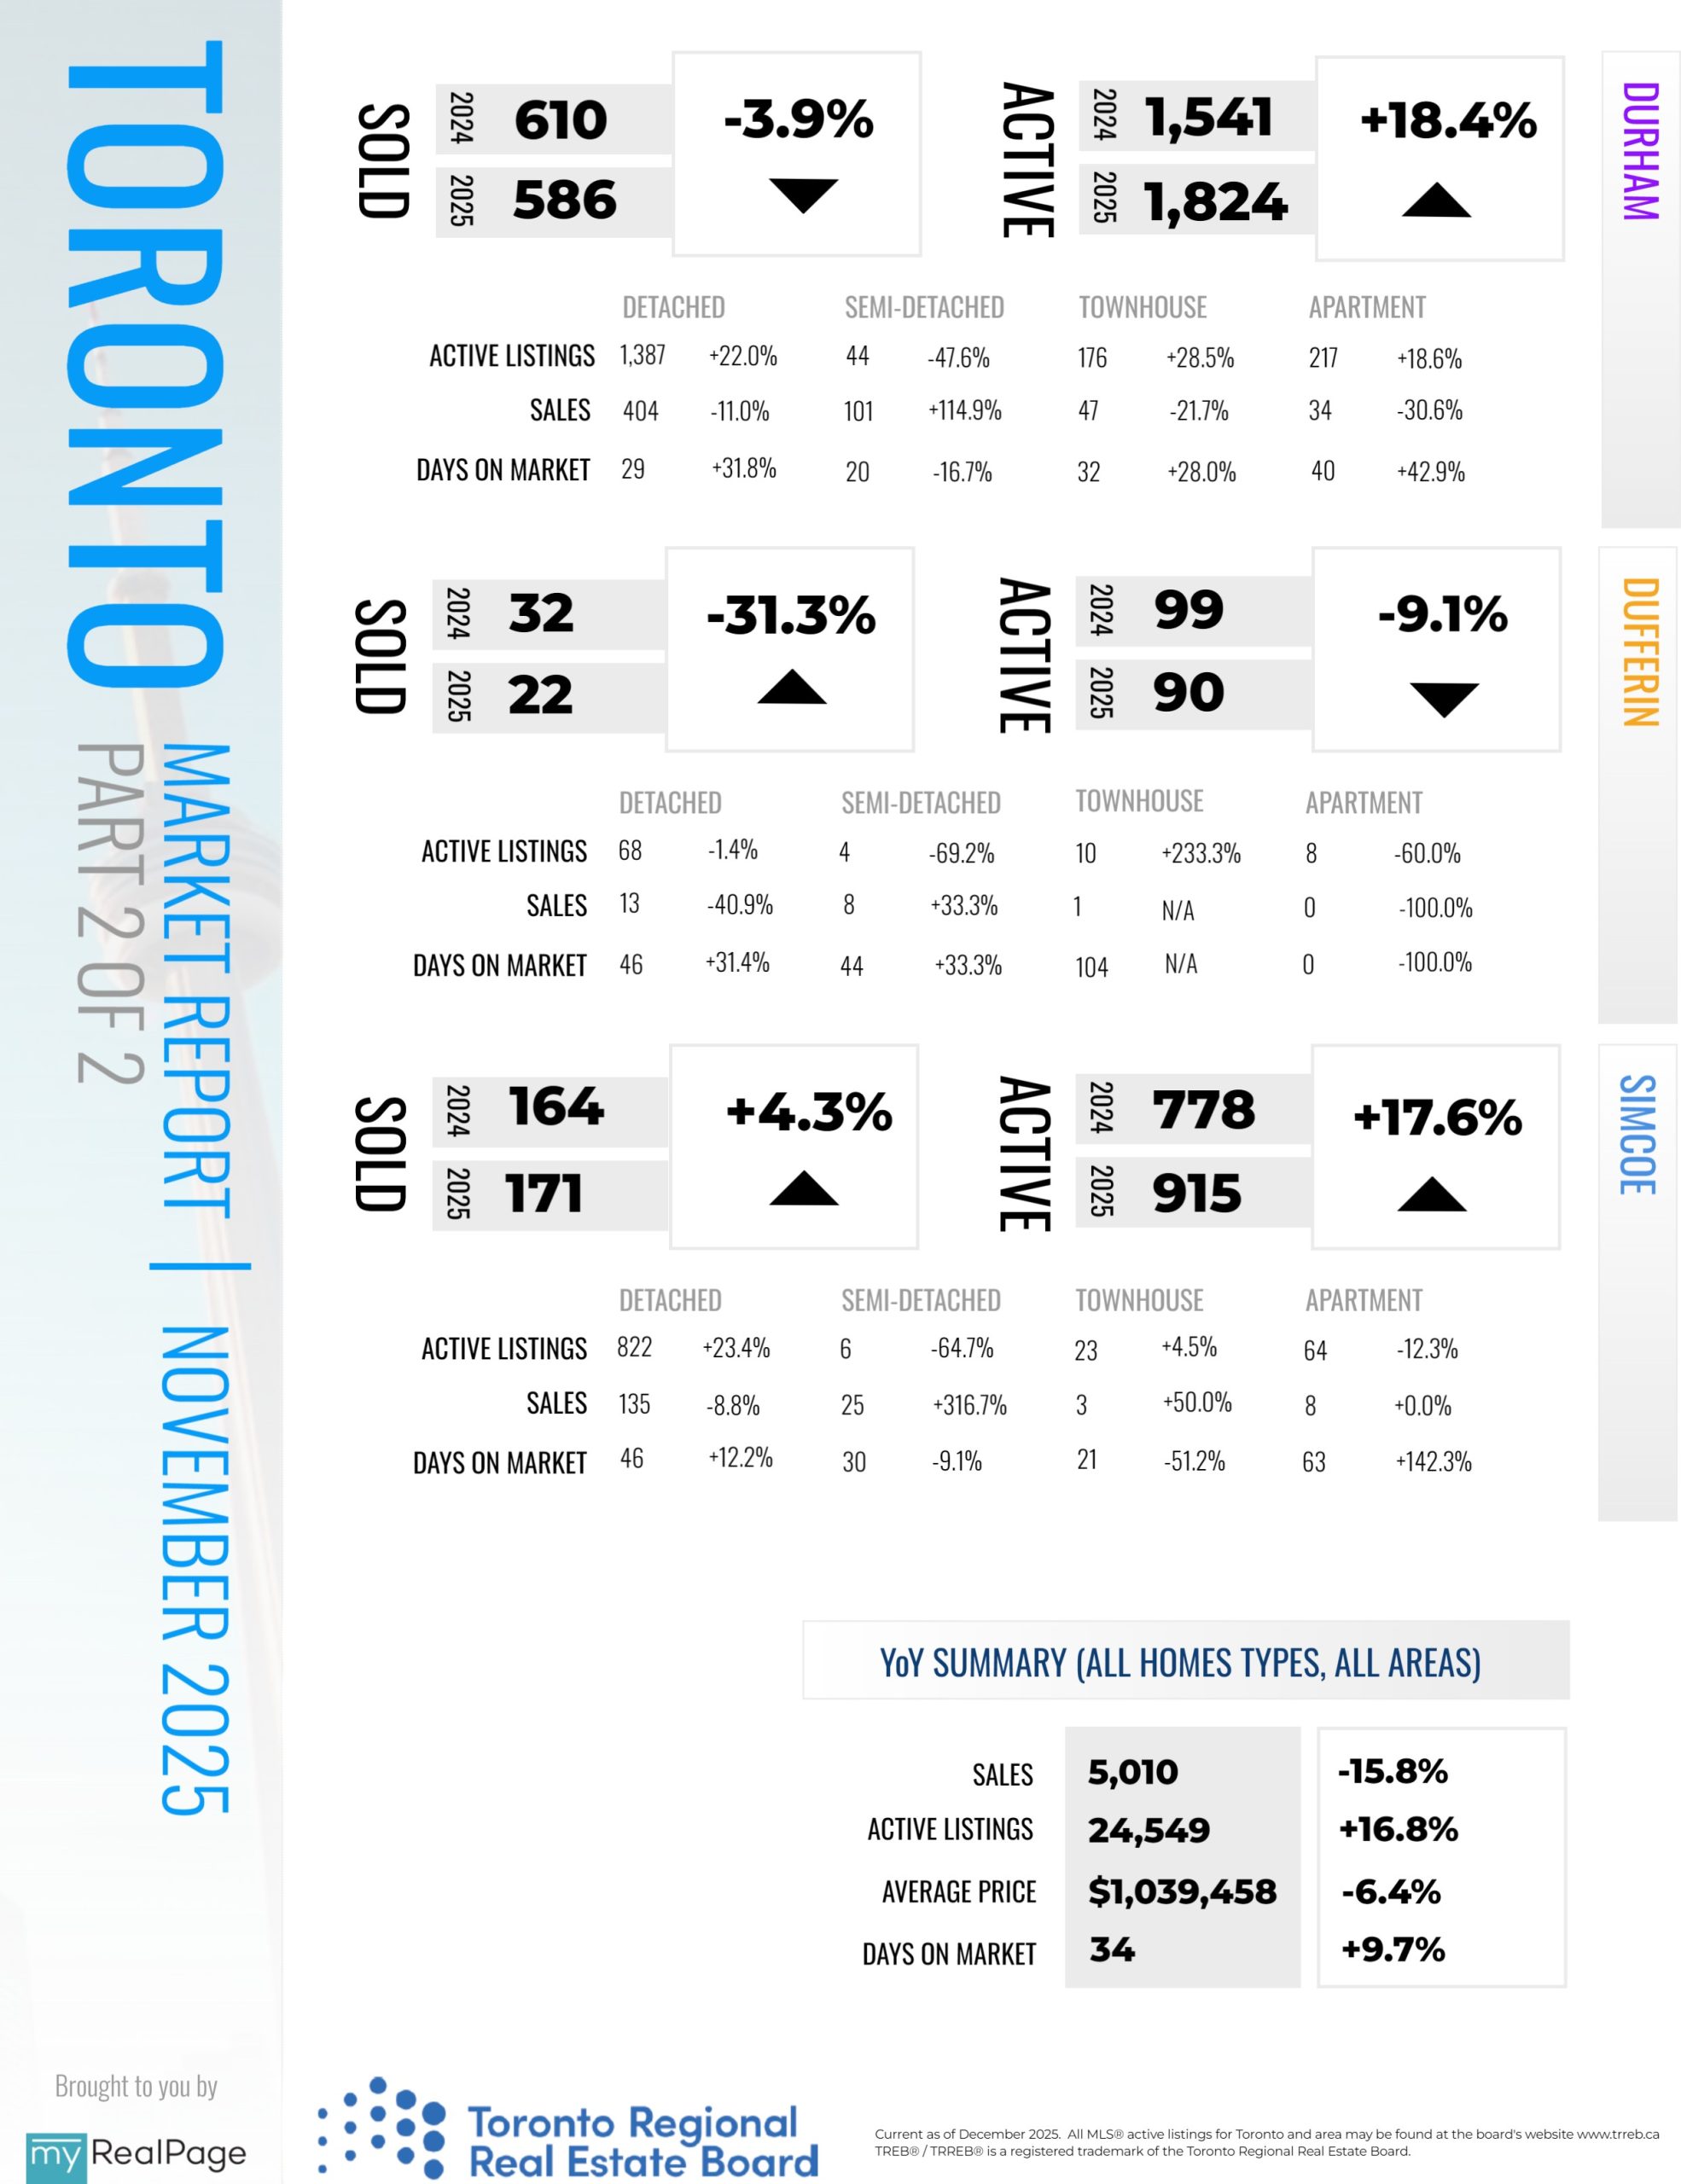
INFOGRAPHICS: November 2025 TRREB Toronto Market Reports
GTA REALTORS Release November Stats
Greater Toronto Area (GTA) home sales, new listings, and average selling price were down compared to a year earlier in November 2024. Intending homebuyers remained on the sidelines awaiting more positive economic news.
“There are many GTA households who want to take advantage of lower borrowing costs and more favourable selling prices. What they need most is confidence in their long-term employment outlook. Fortunately, we saw encouraging news on jobs and the broader economy in November. If this positive momentum continues, consumer confidence will strengthen, and more people will be in a position to consider purchasing a home in 2026,” said TRREB President Elechia Barry-Sproule.
GTA REALTORS® reported 5,010 home sales through TRREB’s MLS® System in November 2025 – down by 15.8 per cent compared to November 2024. New listings entered into the MLS® System amounted to 11,134 – down by four per cent year-over-year.
Read the full report on TRREB website!
The following data is a comparison between November 2025 and November 2024 numbers, and is current as of December of 2025. For last month’s numbers, check out our previous infographic!
Or follow this link for all our TREB / TRREB Infographics!
Download Printable Version – November 2025 TRREB, Toronto Market Report
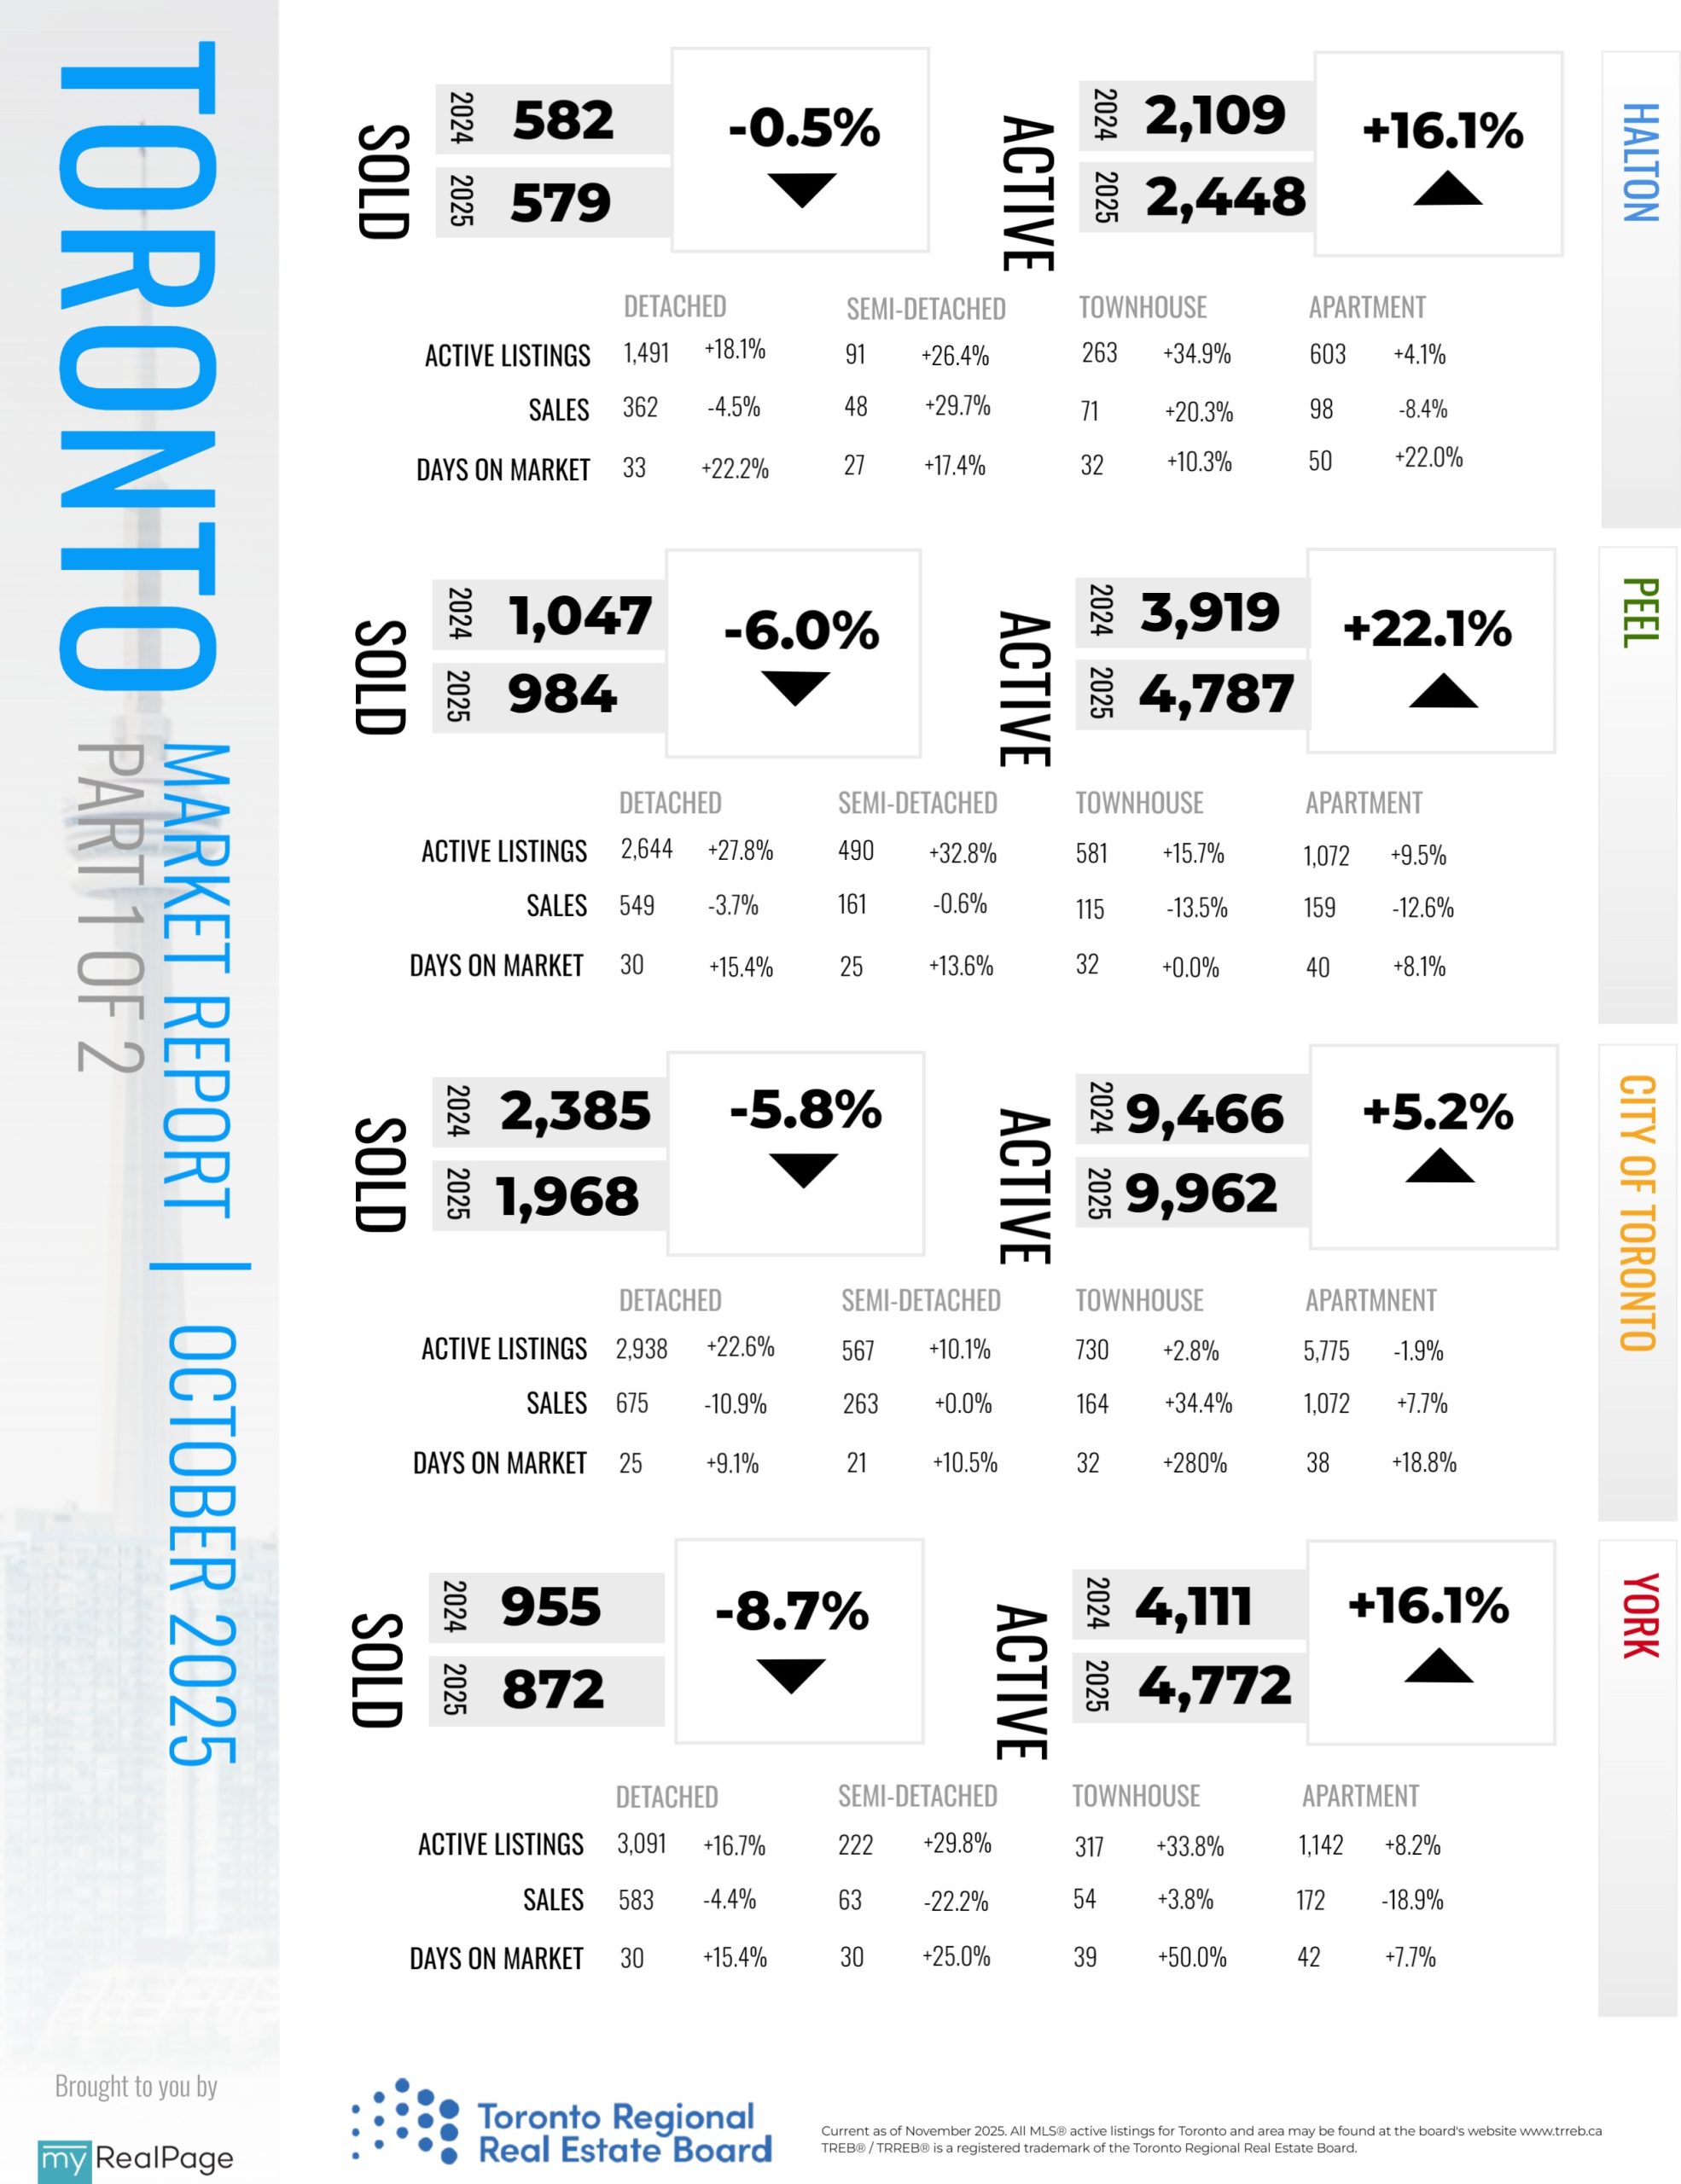
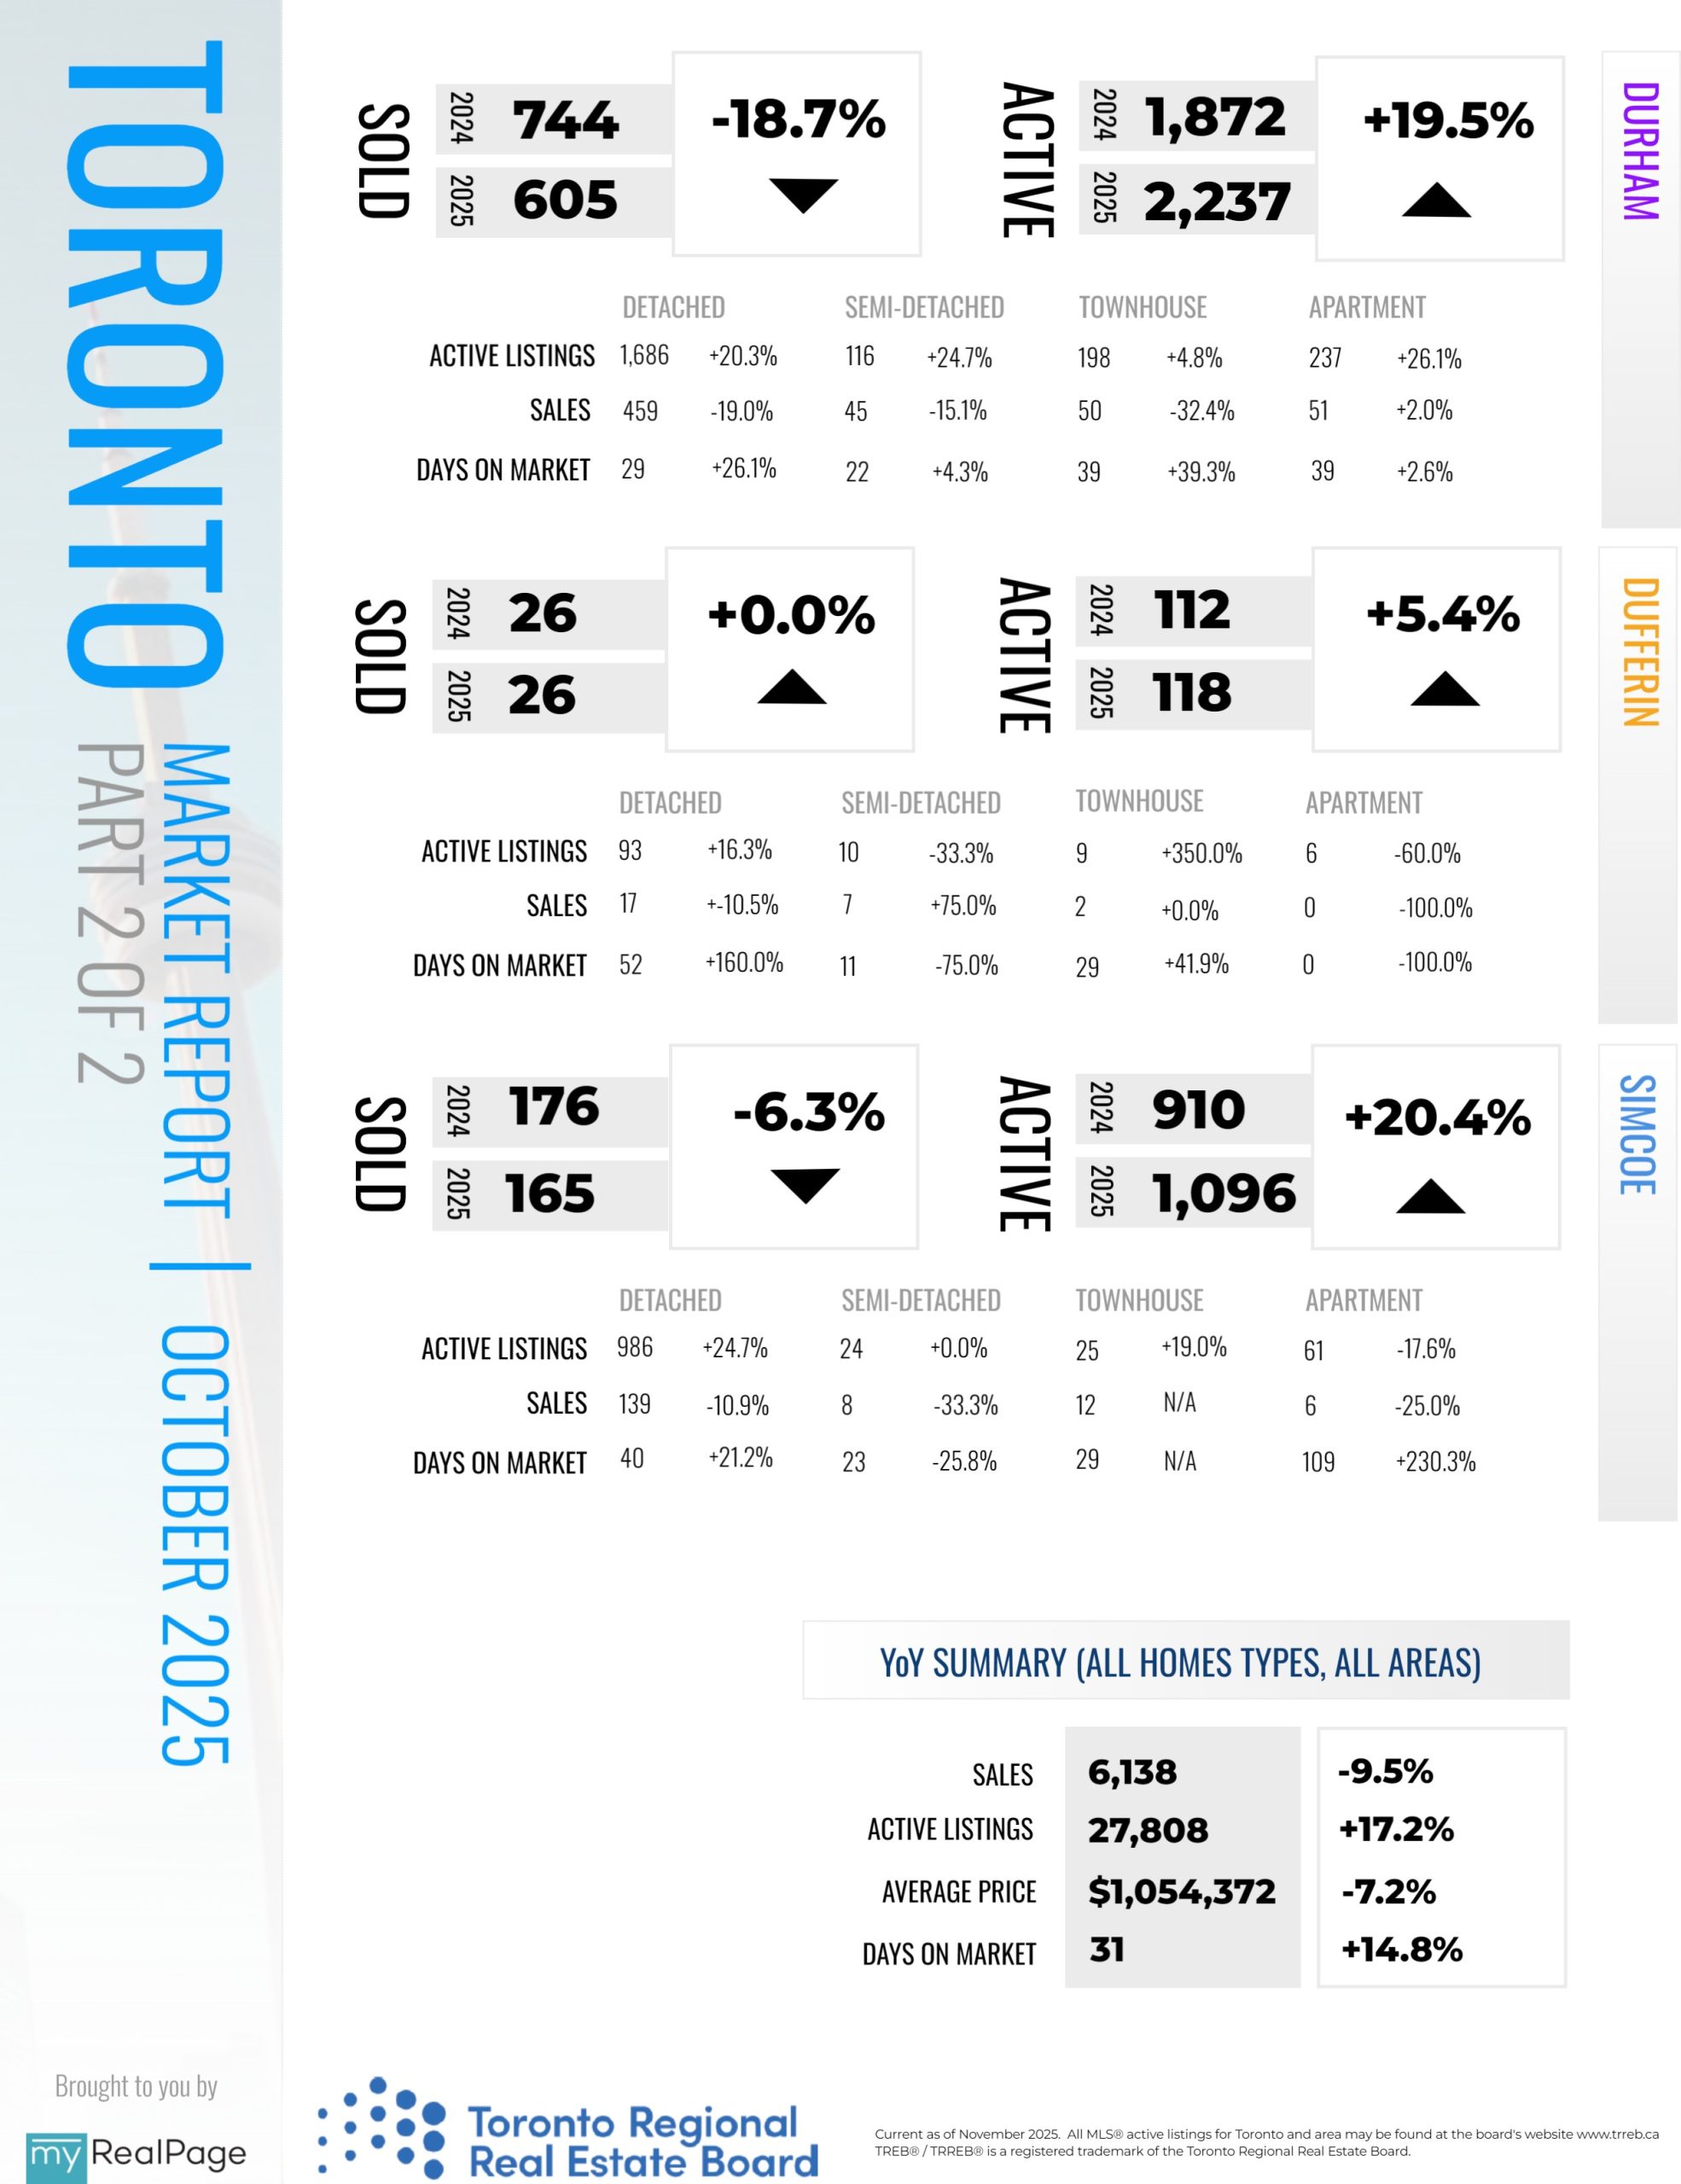
INFOGRAPHICS: October 2025 TRREB Toronto Market Reports
GTA REALTORS Release October Stats
Home sales in the Greater Toronto Area (GTA) were down year-over-year in October, while new listings were up. Market conditions continued to favour homebuyers, as average selling prices were negotiated down alongside lower mortgage rates.
“Buyers who are confident in their employment situation and ability to make their mortgage payments over the long term are benefitting from affordable housing market conditions relative to the past few years. However, many intending homebuyers remain on the sidelines due to uncertainty about their economic future,” said TRREB
President Elechia Barry-Sproule.
GTA REALTORS® reported 6,138 home sales through TRREB’s MLS® System in October 2025 – down by 9.5 per cent compared to October 2024. New listings entered into the MLS® System amounted to 16,069 – up by 2.7 per cent year-over-year.
Read the full report on TRREB website!
The following data is a comparison between October 2025 and October 2024 numbers, and is current as of November of 2025. For last month’s numbers, check out our previous infographic!
Or follow this link for all our TREB / TRREB Infographics!
Download Printable Version – October 2025 TRREB, Toronto Market Report
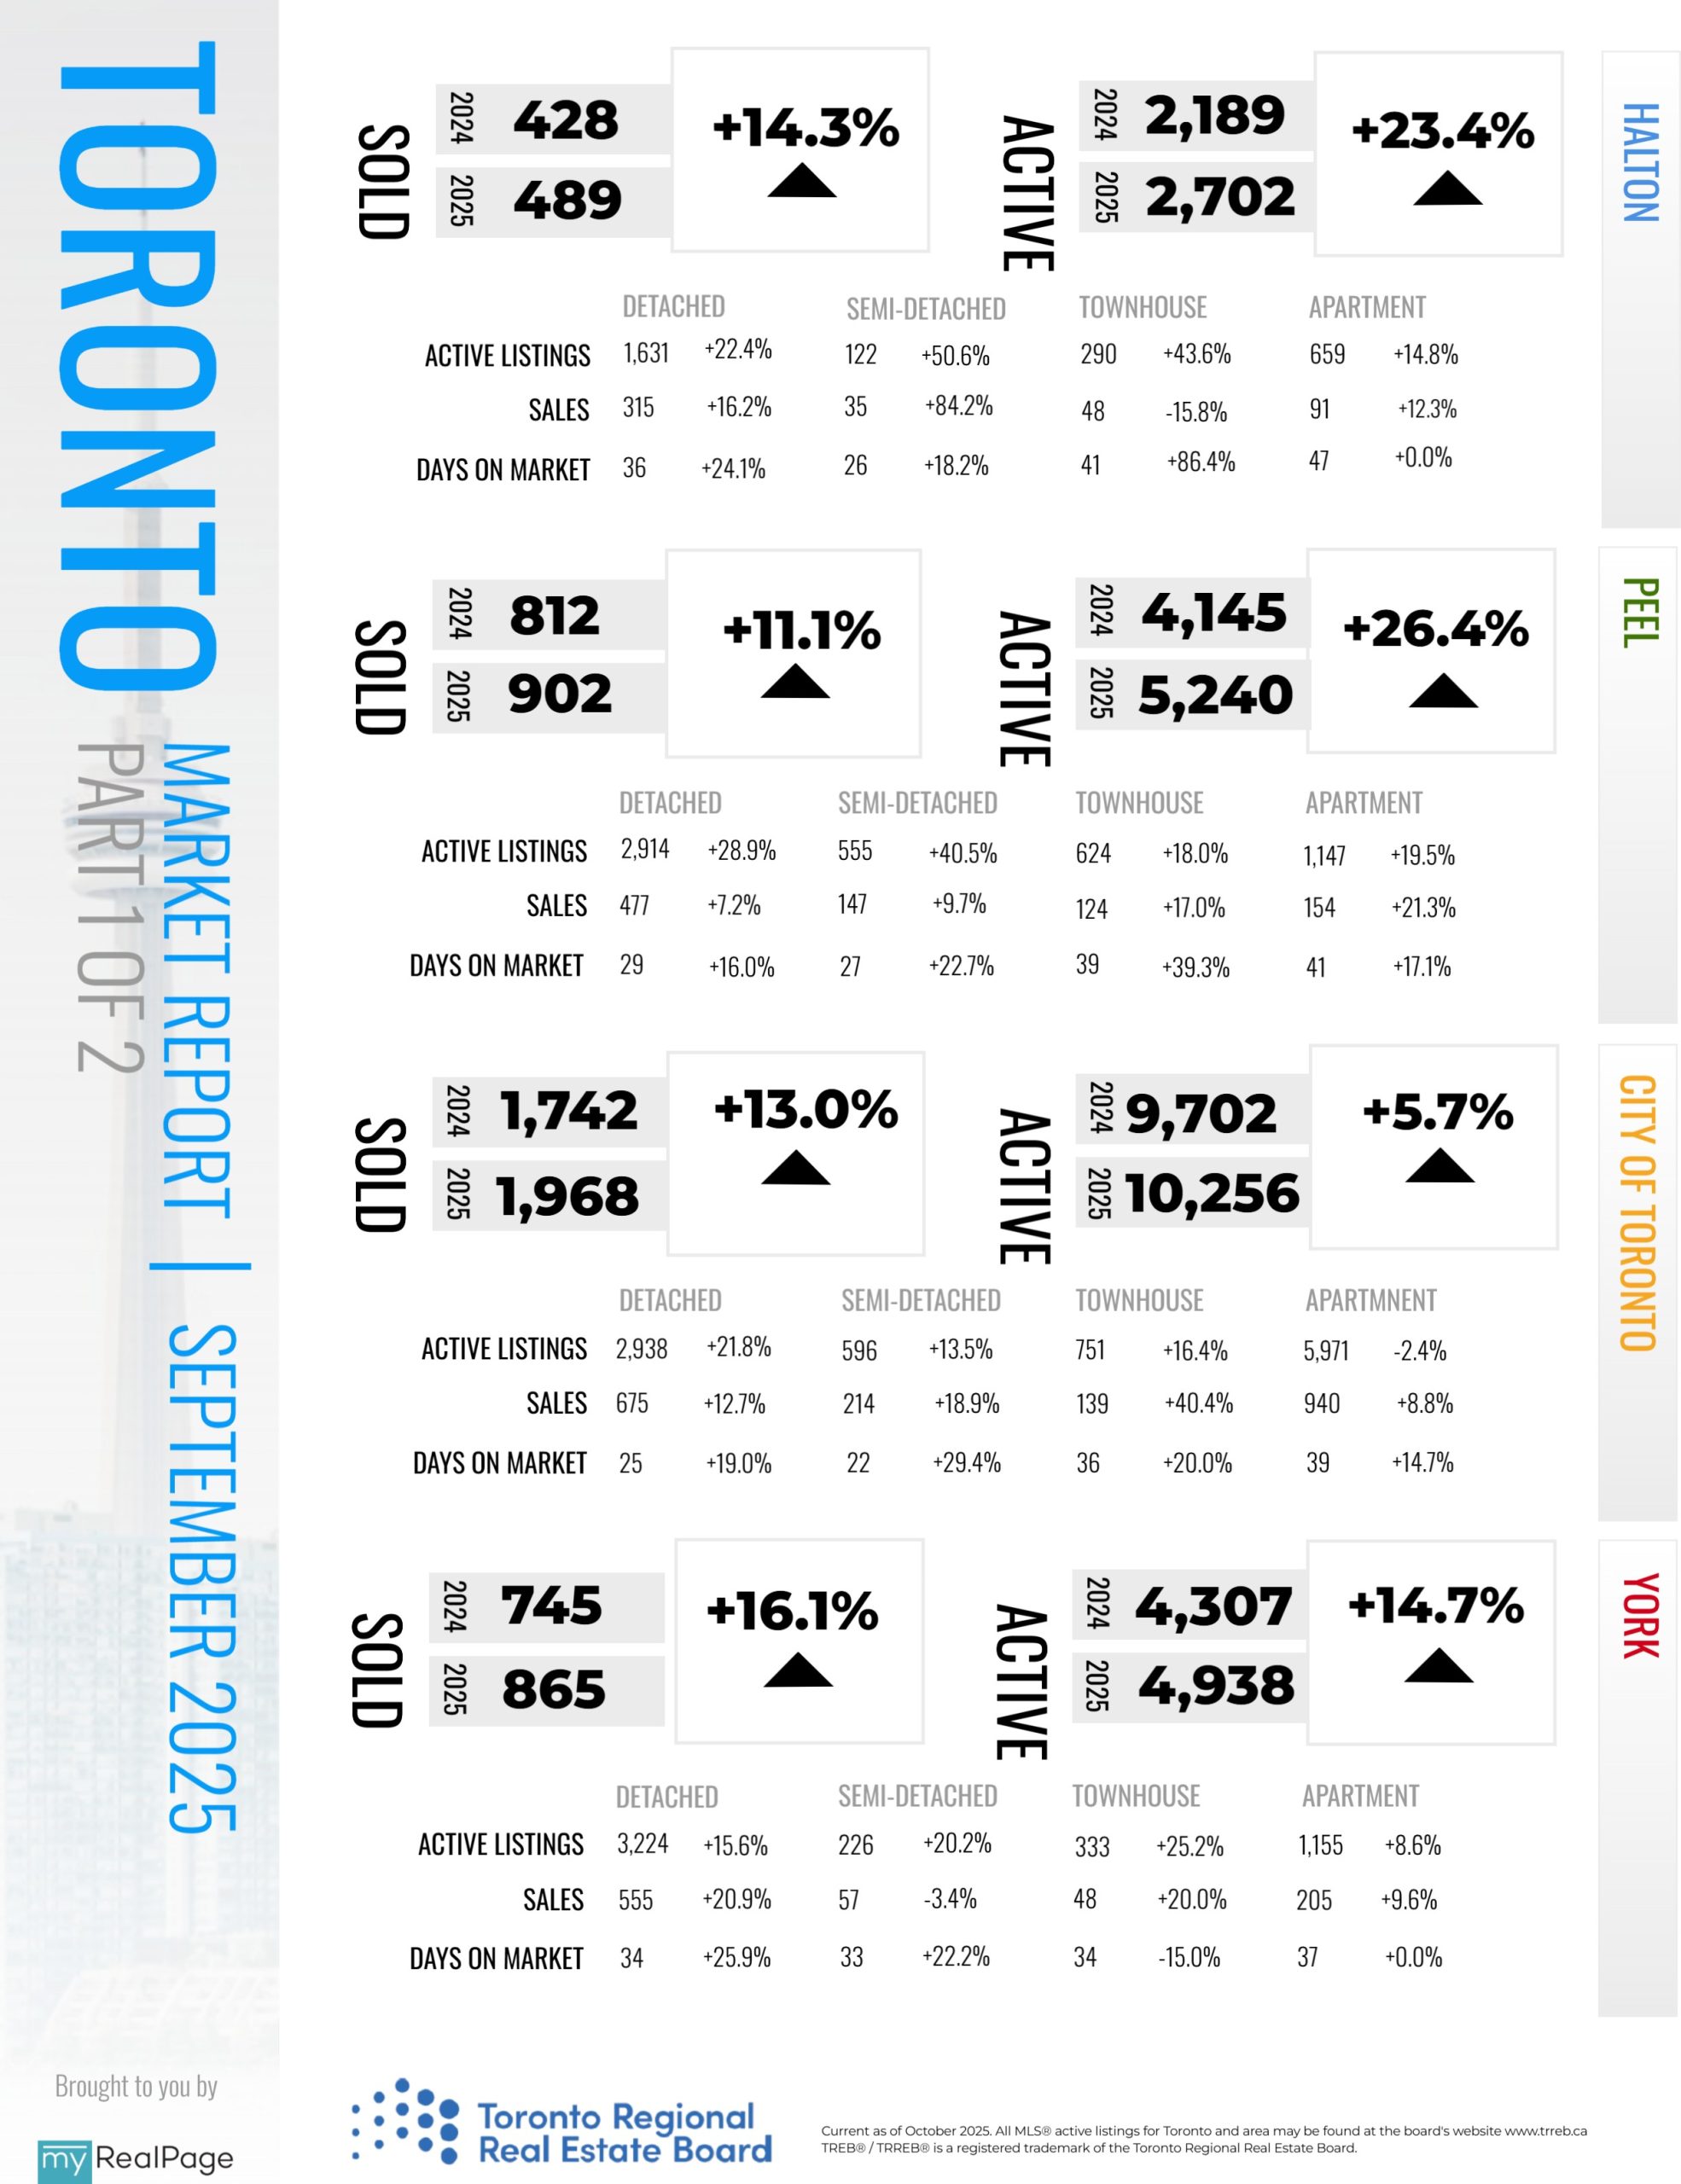
INFOGRAPHICS: September 2025 TRREB Toronto Market Reports
GTA REALTORS Release September Stats
September home sales increased in the Greater Toronto Area (GTA) compared to a year earlier, as more homebuyers sought to take advantage of more affordable monthly mortgage payments. Buyers continued to respond to substantial choice in the marketplace by negotiating the average selling price downward.
“The Bank of Canada’s September interest rate cut was welcome news for homebuyers. With lower borrowing costs, more households are now able to afford monthly mortgage payments on a home that meets their needs. Increased home purchases will also stimulate the economy through housing-related spin-off spending helping to offset the impact of ongoing trade challenges,” said Toronto Regional Real Estate Board (TRREB) President Elechia Barry-Sproule.
GTA REALTORS® reported 5,592 home sales through TRREB’s MLS® System in September 2025 – up by 8.5 per cent compared to September 2024. New listings entered into the MLS® System amounted to 19,260 – up by four per cent year-over-year.
Read the full report on TRREB website!
The following data is a comparison between September 2025 and September 2024 numbers, and is current as of October of 2025. For last month’s numbers, check out our previous infographic!
Or follow this link for all our TREB / TRREB Infographics!
Download Printable Version – August 2025 TRREB, Toronto Market Report

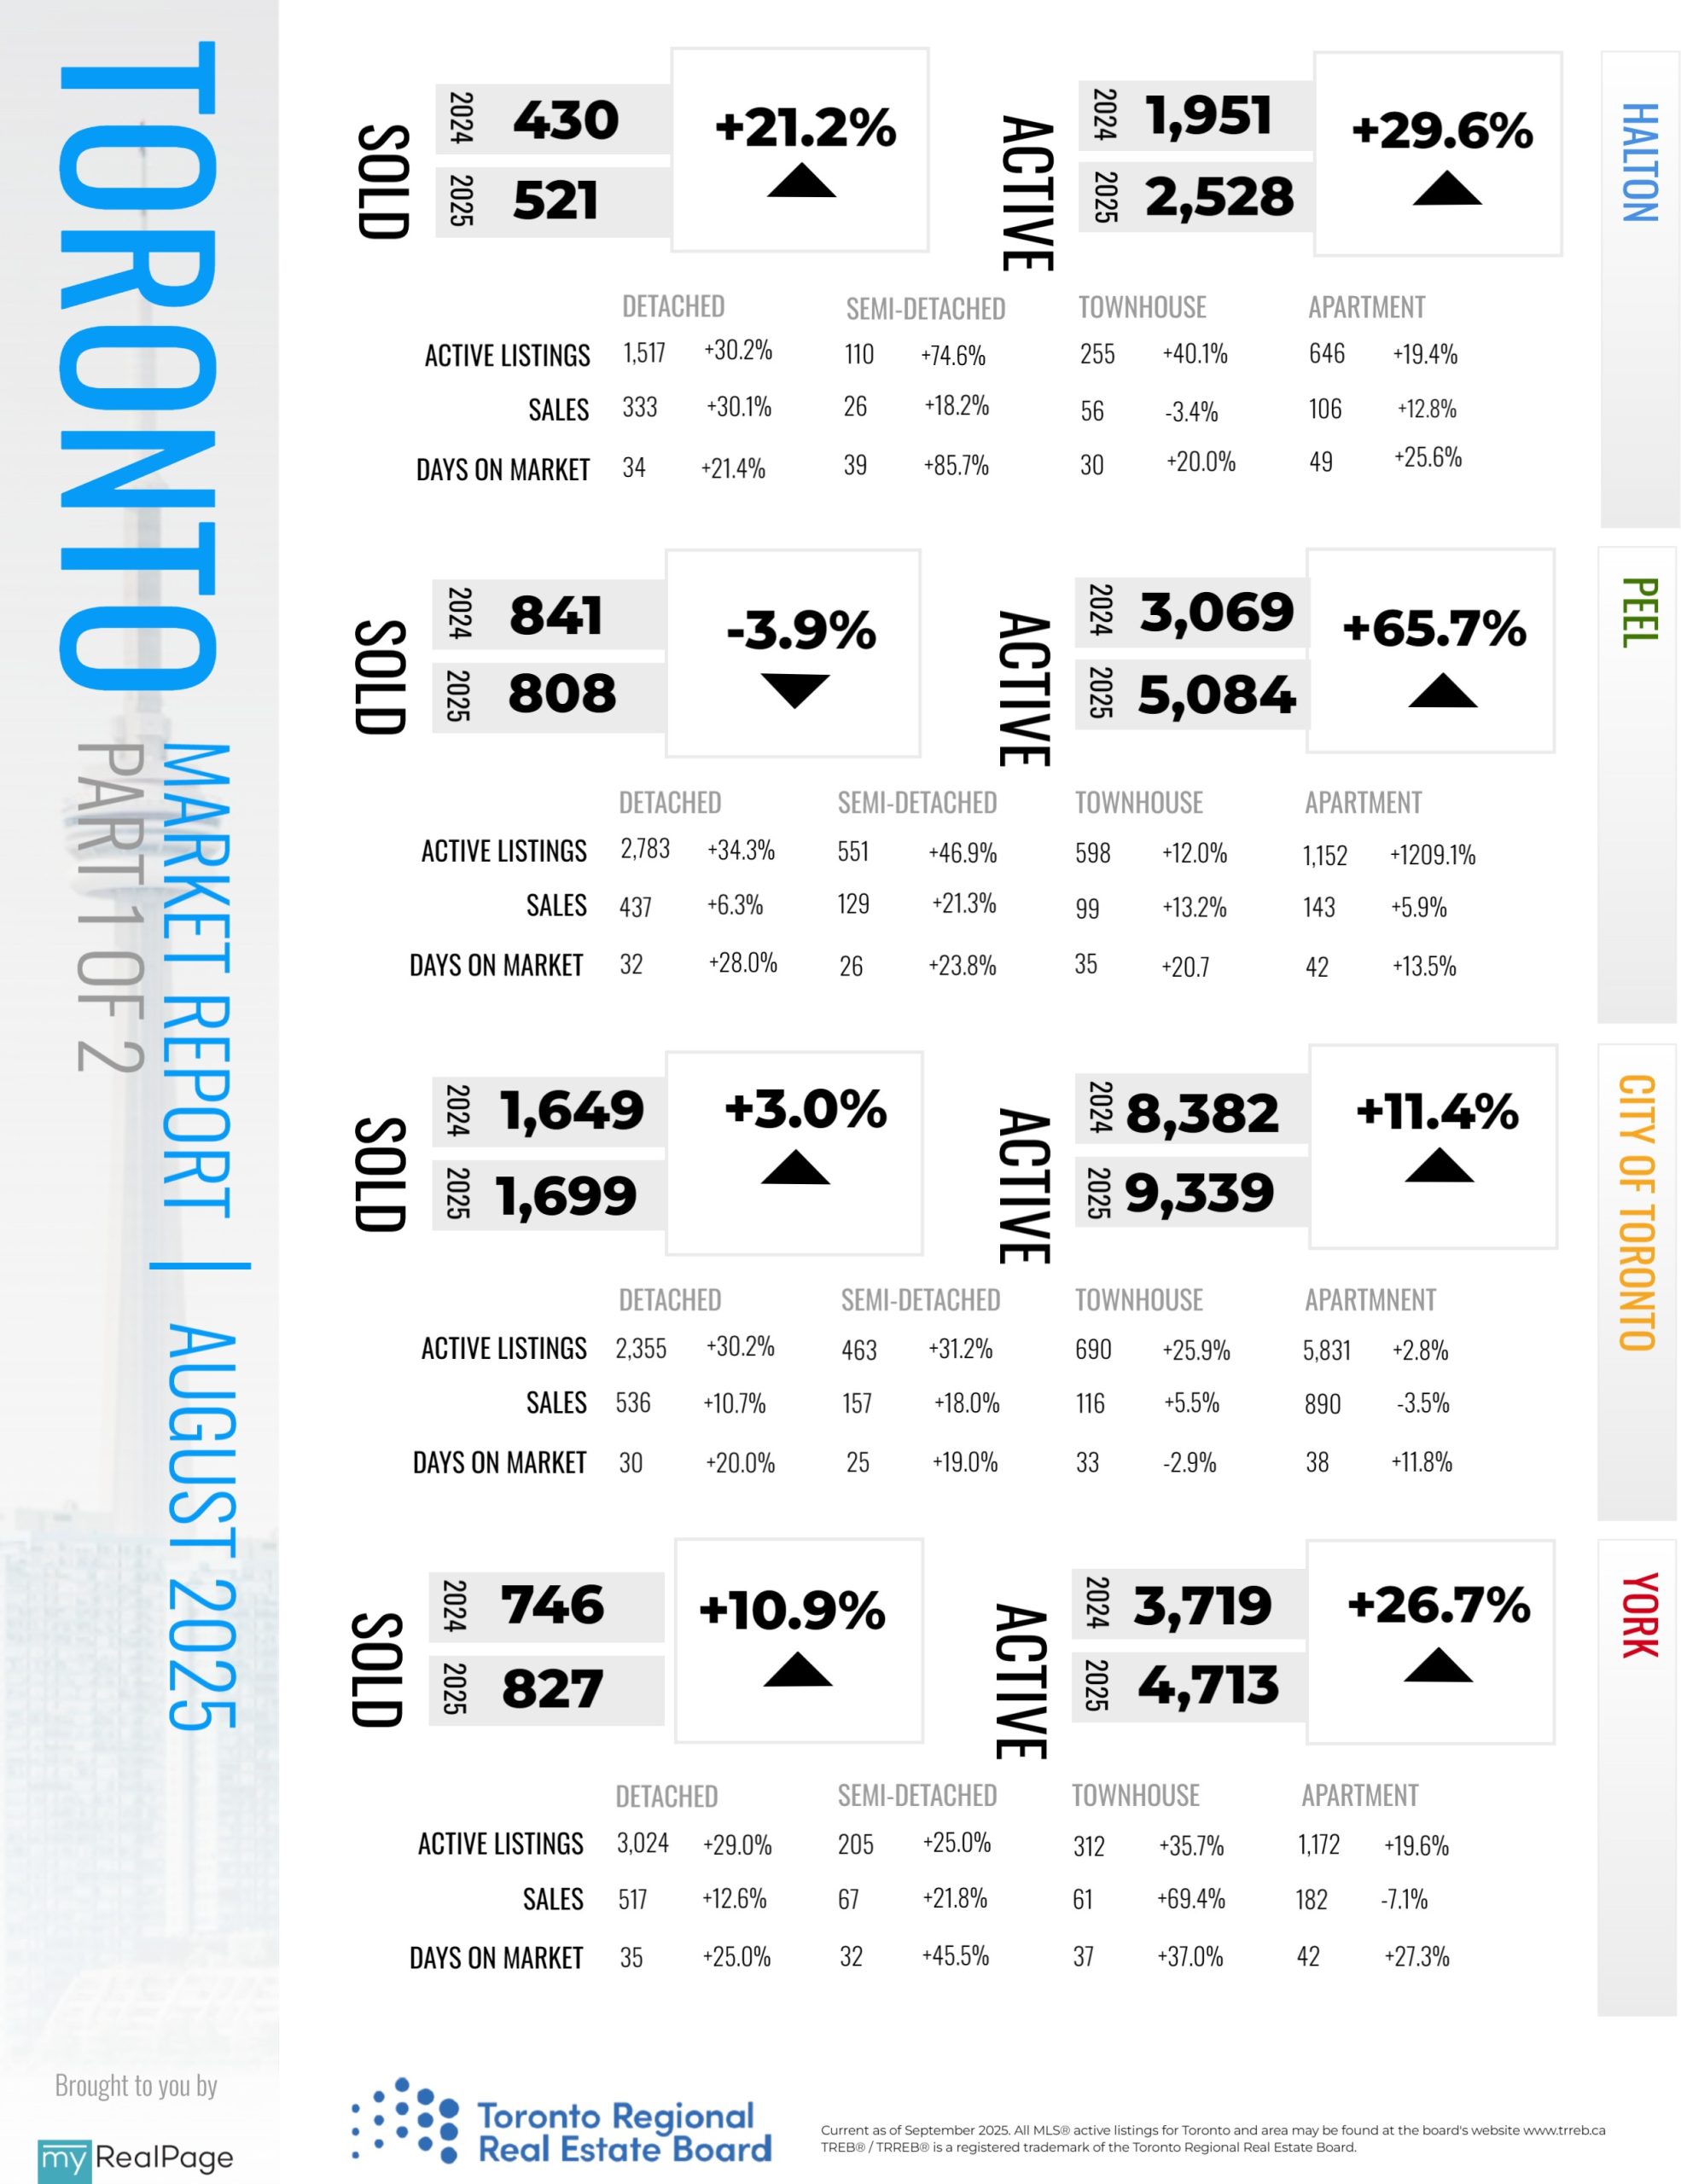
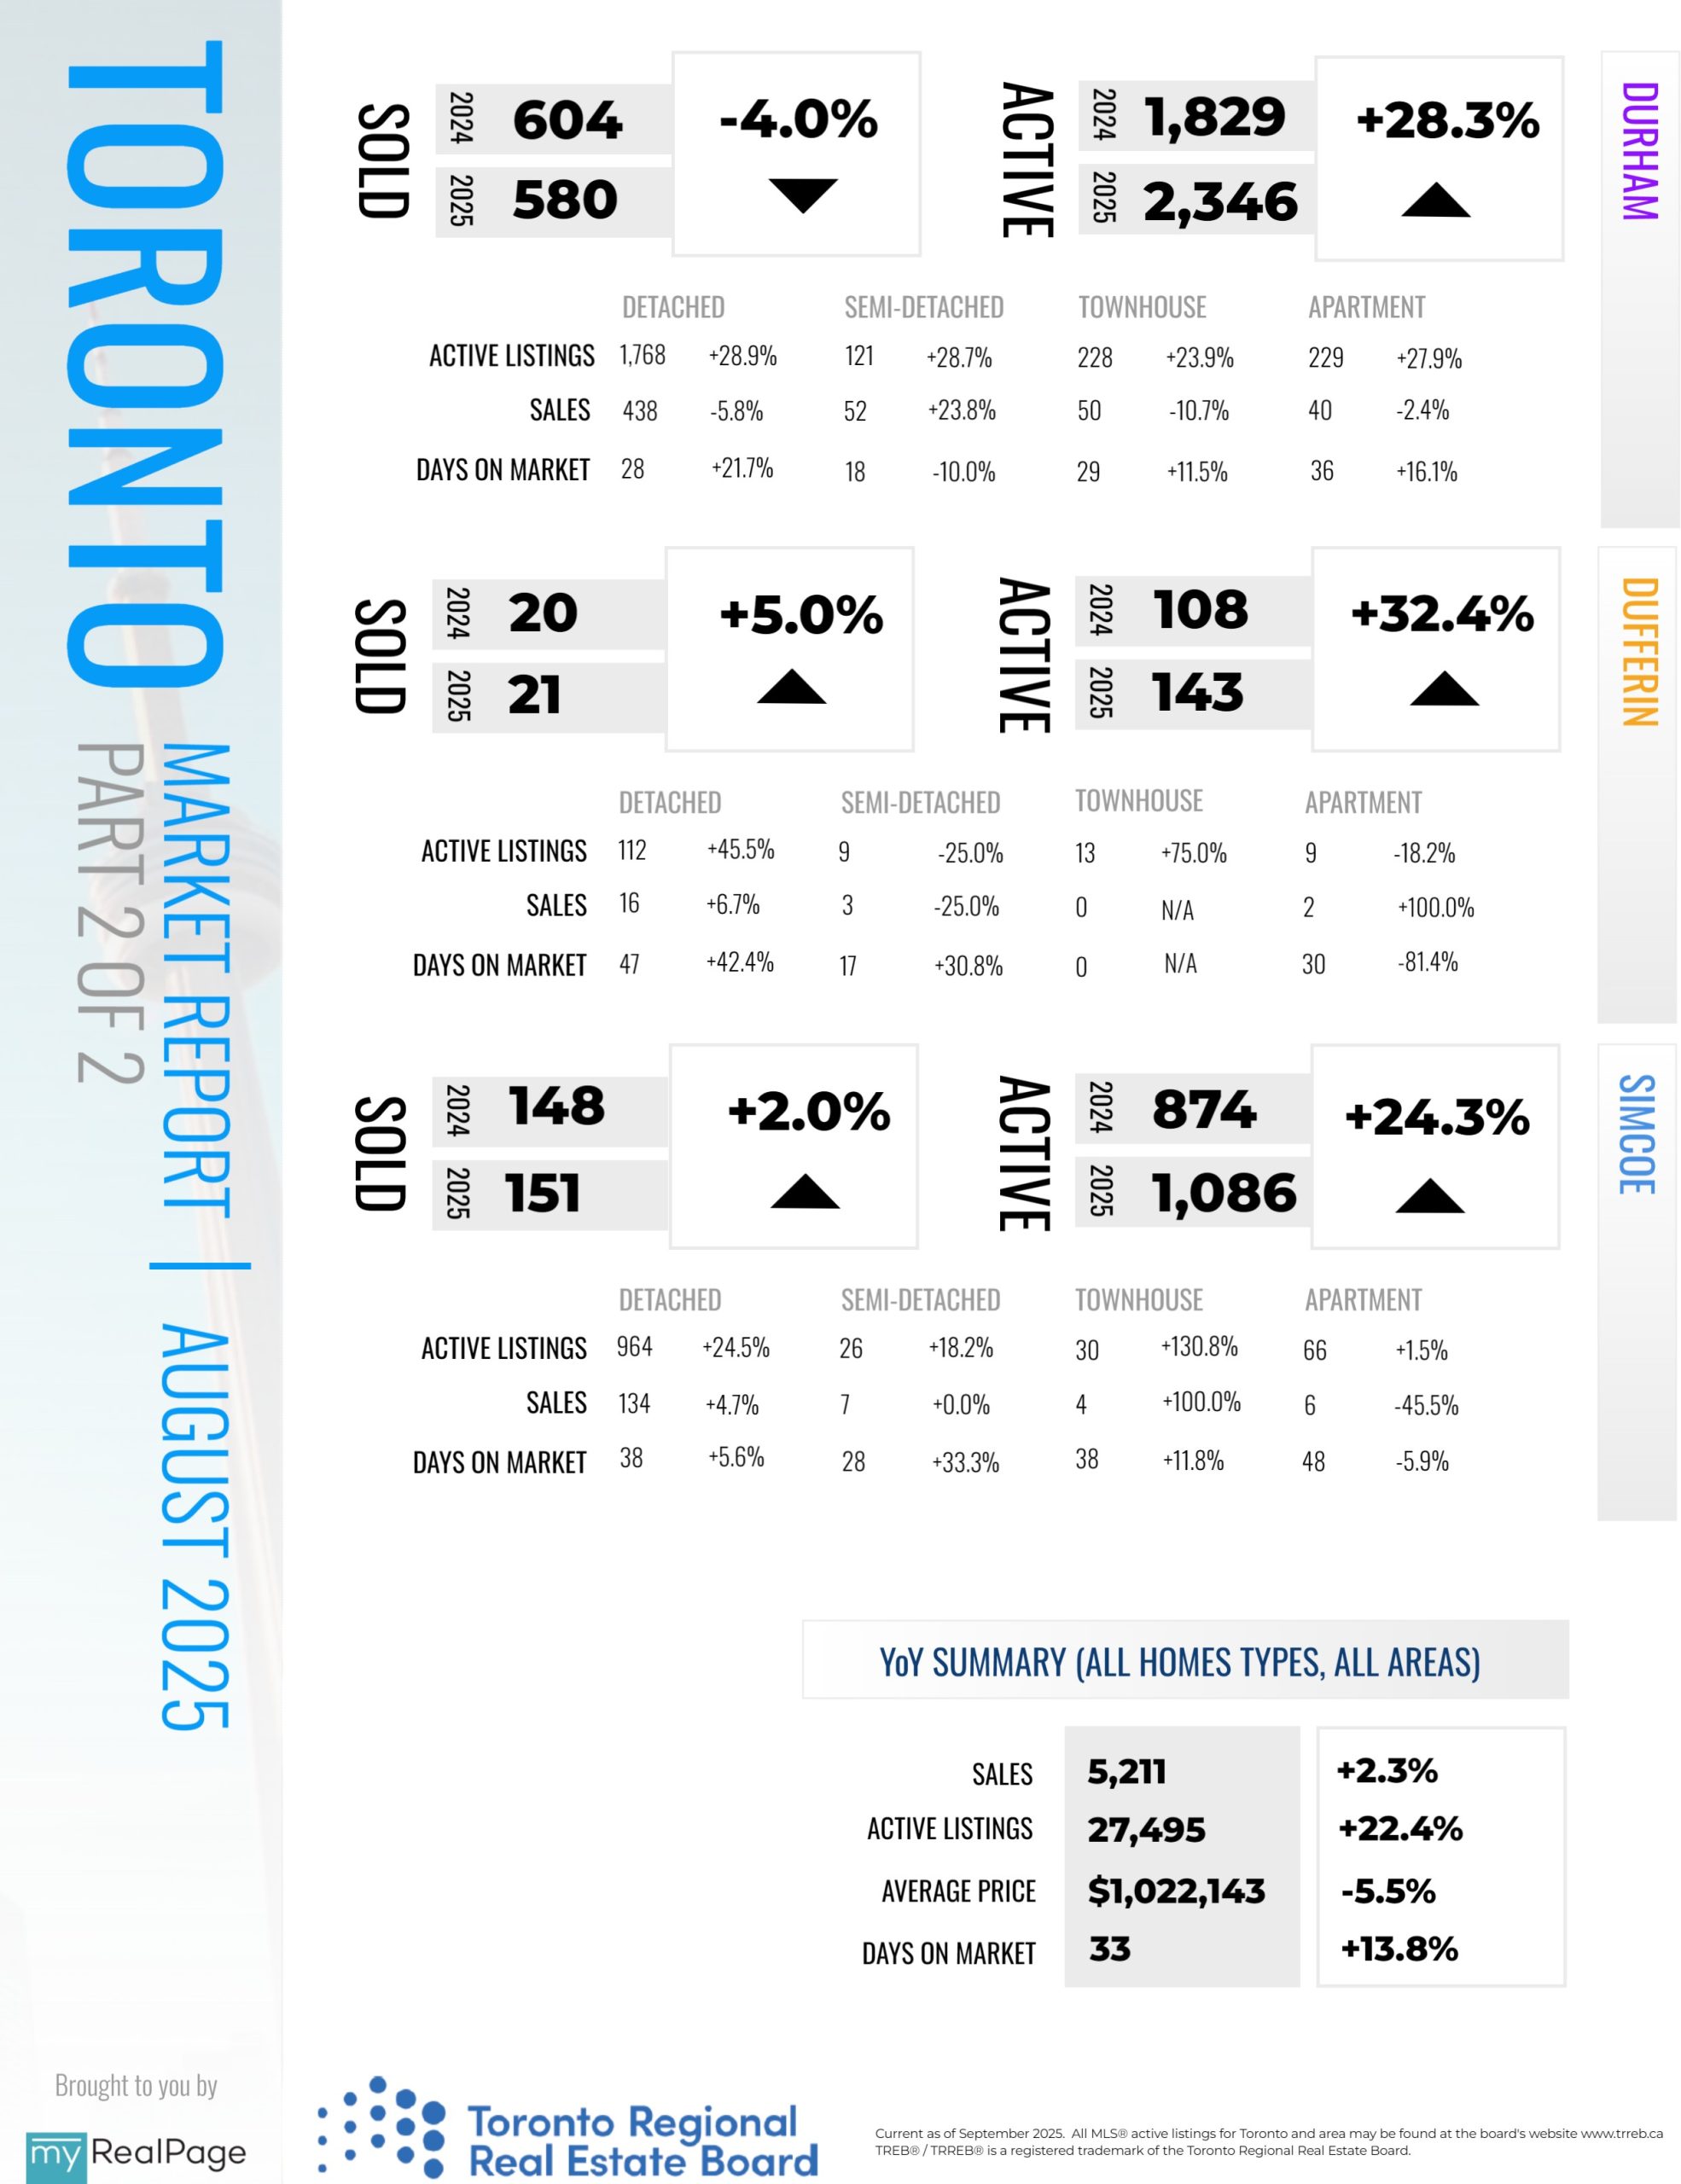
INFOGRAPHICS: August 2025 TRREB Toronto Market Reports
GTA REALTORS Release August Stats
August home sales reported by the Toronto Regional Real Estate Board (TRREB) were up on a year-over-year basis. Over the same period, home buyers benefitted from an even larger increase in the inventory of listings. Average selling prices continued to be negotiated downward due to the elevated choice across market segments.
“Compared to last year, we have seen a modest increase in home sales over the summer. With the economy slowing and inflation under control, additional interest rate cuts by the Bank of Canada could help offset the impact of tariffs. Greater affordability would not only support more home sales but also generate significant economic spin-off benefits,” said TRREB President Elechia Barry-Sproule.
Greater Toronto Area (GTA) REALTORS® reported 5,211 home sales through TRREB’s MLS® System in August 2025 – up by 2.3 per cent compared to August 2024. New listings entered into the MLS® System amounted to 14,038
– up by 9.4 per cent year-over-year.
Read the full report on TRREB website!
The following data is a comparison between August 2025 and August 2024 numbers, and is current as of September of 2025. For last month’s numbers, check out our previous infographic!
Or follow this link for all our TREB / TRREB Infographics!
Download Printable Version – August 2025 TRREB, Toronto Market Report
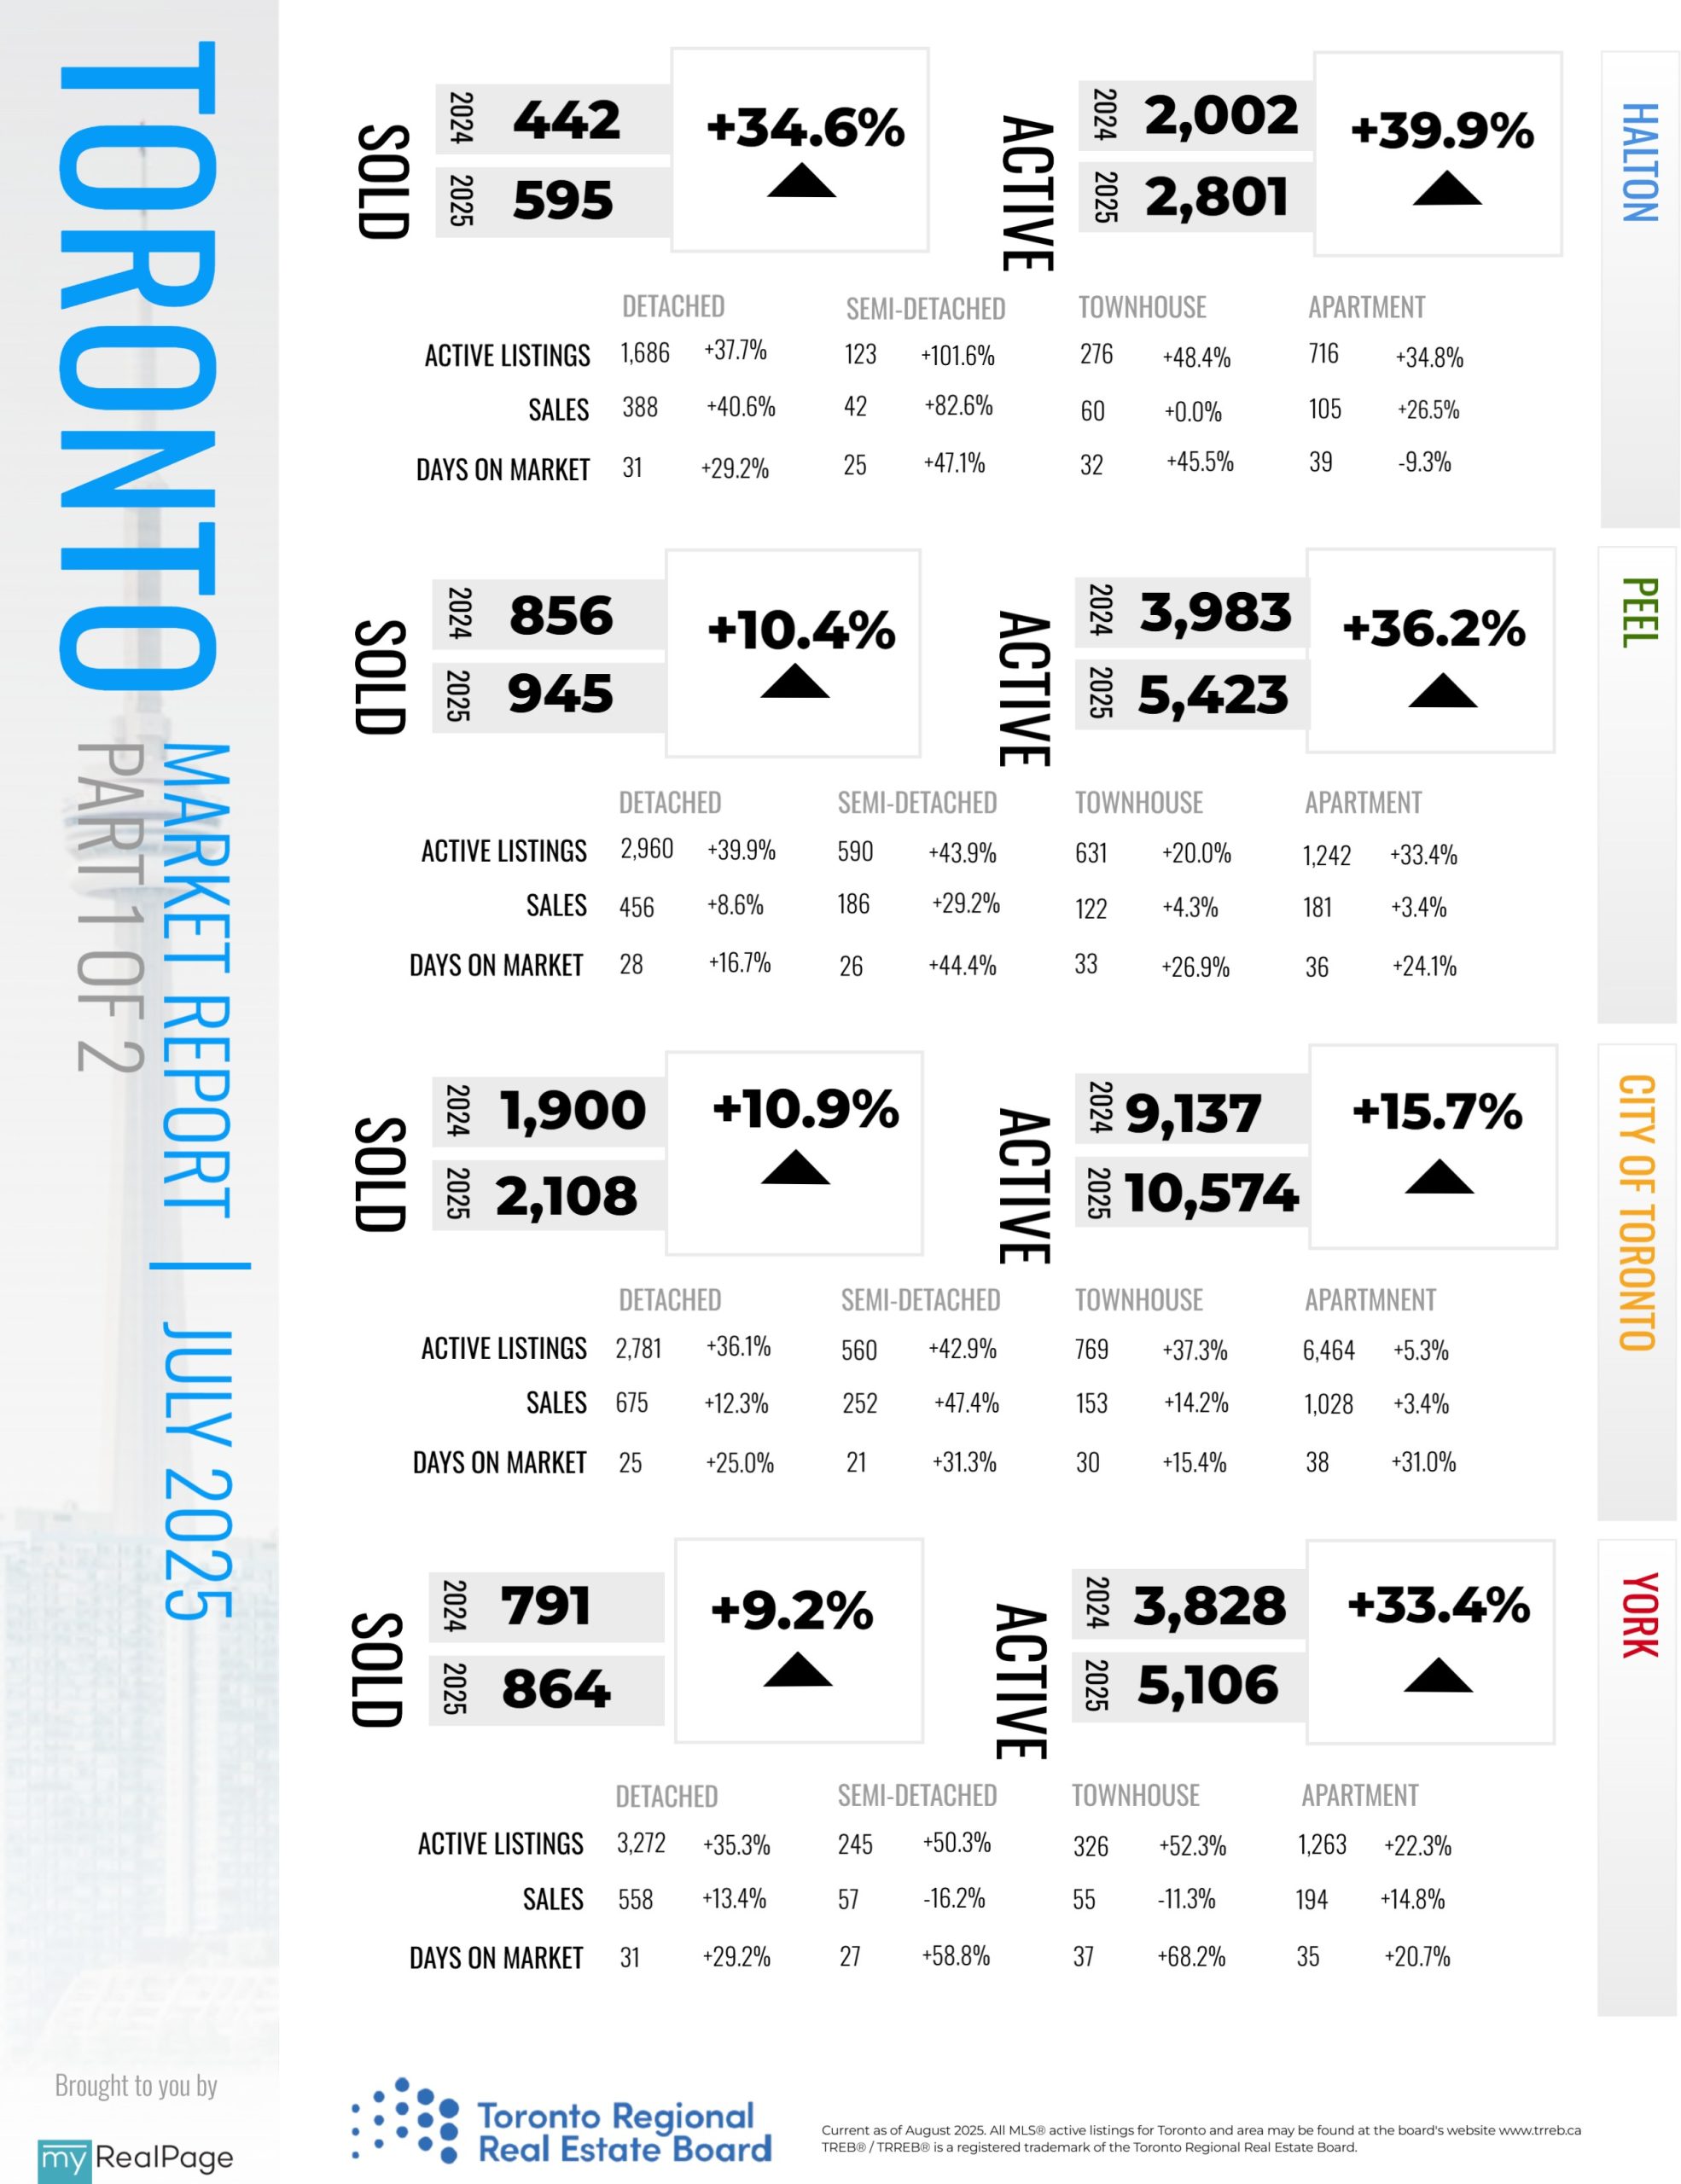
INFOGRAPHICS: July 2025 TRREB Toronto Market Reports
GTA REALTORS Release July Stats
The Greater Toronto Area (GTA) experienced the best home sales result for the month of July since 2021. Sales were also up relative to listings, suggesting a modest tightening in the market compared to last year.
“Improved affordability, brought about by lower home prices and borrowing costs, is starting to translate into increased home sales. More relief is required, particularly where borrowing costs are concerned, but it’s clear that a growing number of households are finding affordable options for homeownership,” said Toronto Regional Real Estate Board
(TRREB) President Elechia Barry-Sproule.
GTA REALTORS® reported 6,100 home sales through TRREB’s MLS® System in July 2025 – up by 10.9 per cent compared to July 2024. New listings entered into the MLS® System totalled 17,613 – up by 5.7 per cent year-over- year.
On a seasonally adjusted basis, July home sales increased month-over-month compared to June 2025. New listings also rose compared to June, but by a much lesser rate. With sales increasing relative to listings, market conditions tightened.
Read the full report on TRREB website!
The following data is a comparison between July 2025 and July 2024 numbers, and is current as of August of 2025. For last month’s numbers, check out our previous infographic!
Or follow this link for all our TREB / TRREB Infographics!
Download Printable Version – July 2025 TRREB, Toronto Market Report